P
Loading blog...
Loading blog...
Not all product problems affect satisfaction equally. IPA and Penalty Analysis help you find the ones that matter most.
Luis Ortega
Apr 08, 2026•5 min read
Customer satisfaction scores are averages. And averages hide things.
A hotel with an overall satisfaction score of 7.8 out of 10 might have one attribute — say, wifi quality — that is rated 4.2 by 60 percent of guests who consider it very important. That single attribute is dragging the entire score down, and no amount of improvement to room cleanliness or breakfast quality will fix it.
Importance-Performance Analysis and Penalty Analysis are the tools designed to surface exactly this kind of problem. They tell you not just what is performing poorly, but which poor performers are actually costing you satisfaction — and which ones most customers barely notice.
IPA was first developed by Martilla and James in their 1977 landmark paper in the Journal of Marketing. The idea is straightforward: collect data on both how important each attribute is to customers and how well the product or service is currently delivering on each attribute. Then plot those two scores on a 2x2 matrix.
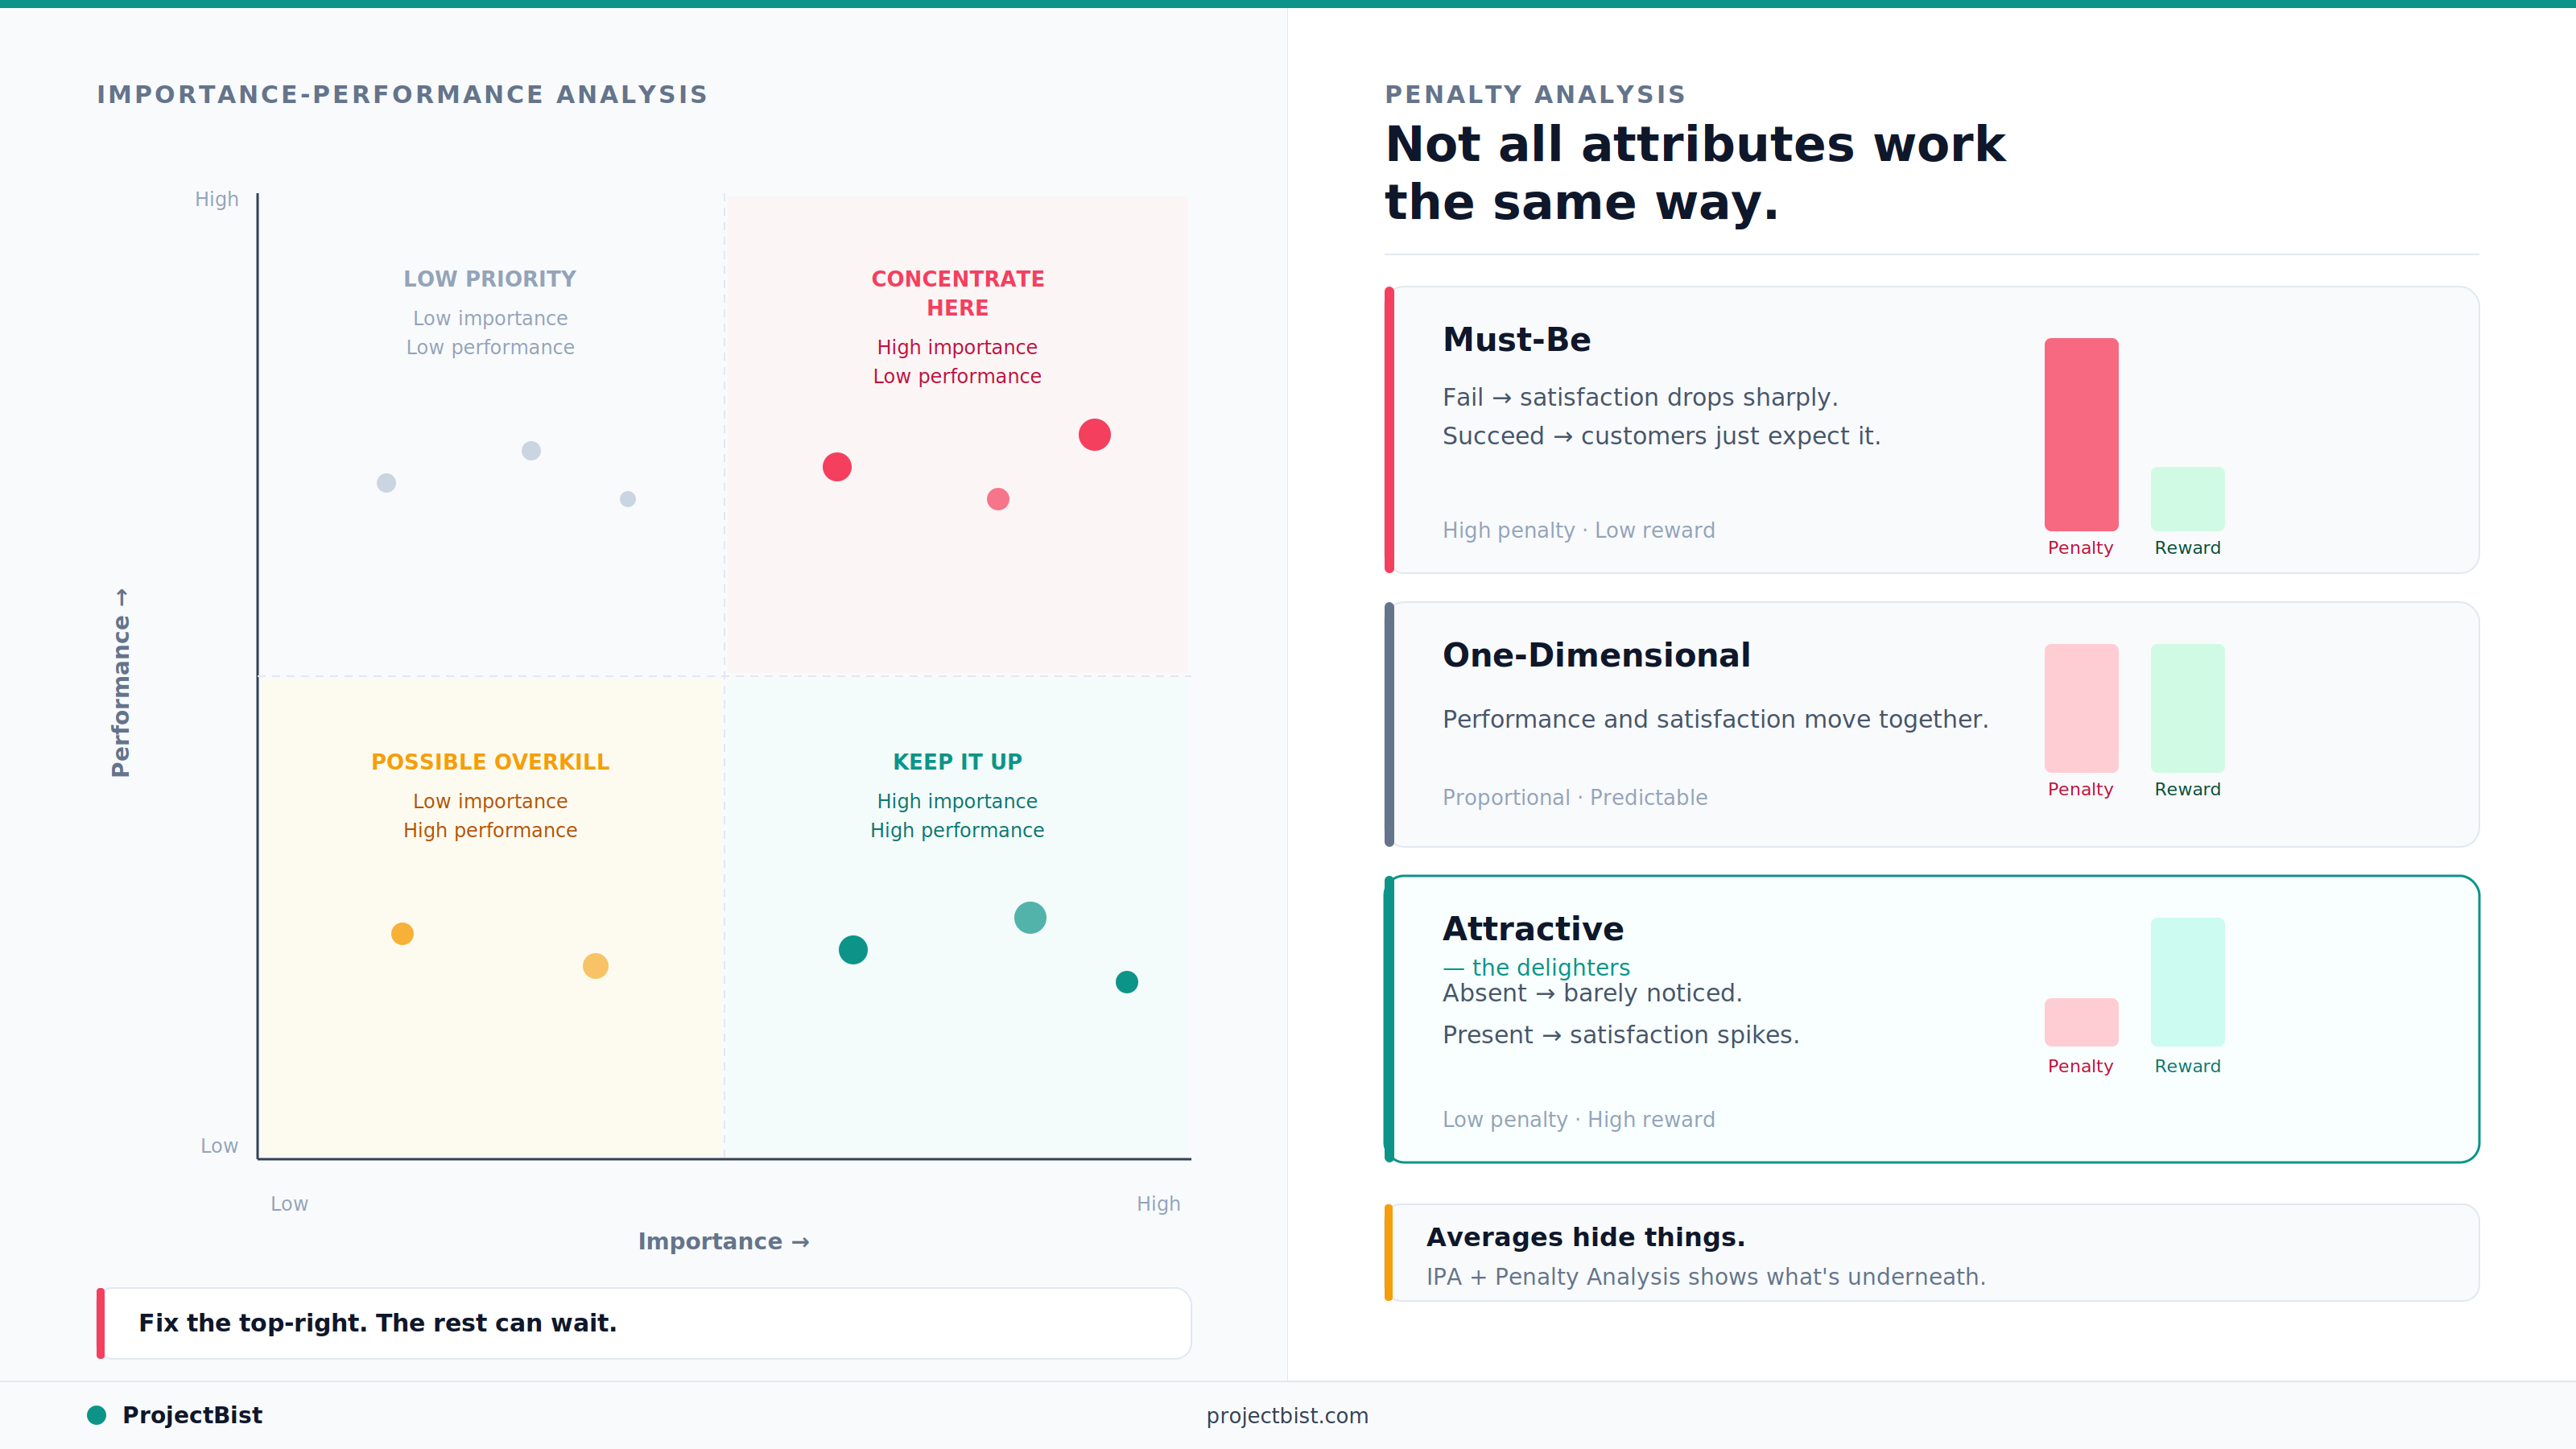
The matrix produces four quadrants, each with a clear strategic implication:
IPA does not tell you everything is a priority. That is the point. It tells you what to stop worrying about so you can focus on what actually moves satisfaction.
IPA treats the relationship between attribute performance and satisfaction as linear and symmetric: better performance on an attribute always produces more satisfaction. But this is not actually how customer psychology works.
Research from the Kano model and the Penalty-Reward Contrast Analysis (PRCA) framework shows that attribute performance has an asymmetric effect on satisfaction. Specifically:
Penalty Analysis uses regression techniques to calculate the asymmetric impact of each attribute. It estimates how much satisfaction drops when an attribute performs poorly (the penalty) versus how much it increases when the attribute performs well (the reward). Attributes with high penalties and low rewards are your Must-Be attributes — the ones that actively damage satisfaction when they fail.
Run a regression with overall satisfaction as the dependent variable and each attribute's performance as predictors. Then split the data: run the regression separately for respondents who rated the attribute above average versus those who rated it below average. The differential in the regression coefficient between those two groups is your penalty/reward contrast.
In practical terms, a survey research platform or statistical software like SPSS, R, or Stata is needed to run this properly. The output tells you which attributes have large penalties (actively damage satisfaction when poor) versus which have large rewards (significantly boost satisfaction when excellent).
The most powerful approach combines IPA and Penalty Analysis. IPA tells you where the performance gaps are and what customers value most. Penalty Analysis tells you which of those gaps is actively punishing your satisfaction score versus which is simply underperforming on something people expect but do not feel strongly about.
Together, they give you a prioritized action list that is grounded in both customer importance and the actual behavioral impact of each attribute on satisfaction.
What is the difference between IPA and the Kano model?
IPA measures the current gap between importance and performance using customer survey ratings. The Kano model categorizes product features into types (Must-Be, One-Dimensional, Attractive) based on how their presence or absence affects satisfaction. They are complementary: IPA shows you where the performance gaps are; the Kano model explains the nature of those gaps.
How many attributes should I include in an IPA study?
Between 8 and 15 attributes is the practical range for most studies. Fewer than 8 and the matrix lacks resolution. More than 15 and respondent fatigue starts to affect the reliability of importance ratings.
Can I use IPA for service quality research?
Yes. IPA was originally developed in the context of service quality and remains widely used in hospitality, healthcare, education, and financial services research to prioritize service improvement efforts.
What statistical software do I need for Penalty Analysis?
SPSS, R, Stata, or even Python with the statsmodels library can run the regression needed for penalty analysis. Some dedicated market research platforms also offer penalty analysis as a built-in analysis module.
Sources: Martilla and James (1977), Journal of Marketing; Kano et al. (1984), Attractive Quality and Must-Be Quality; PLOS ONE — Empirical Research on Kano's Model (2017); Albayrak and Caber (2013), Total Quality Management; Wikipedia — Kano Model
Newsletter
Personalize your updates! Subscribe to ProjectBist's Newsletter and choose from the following categories.
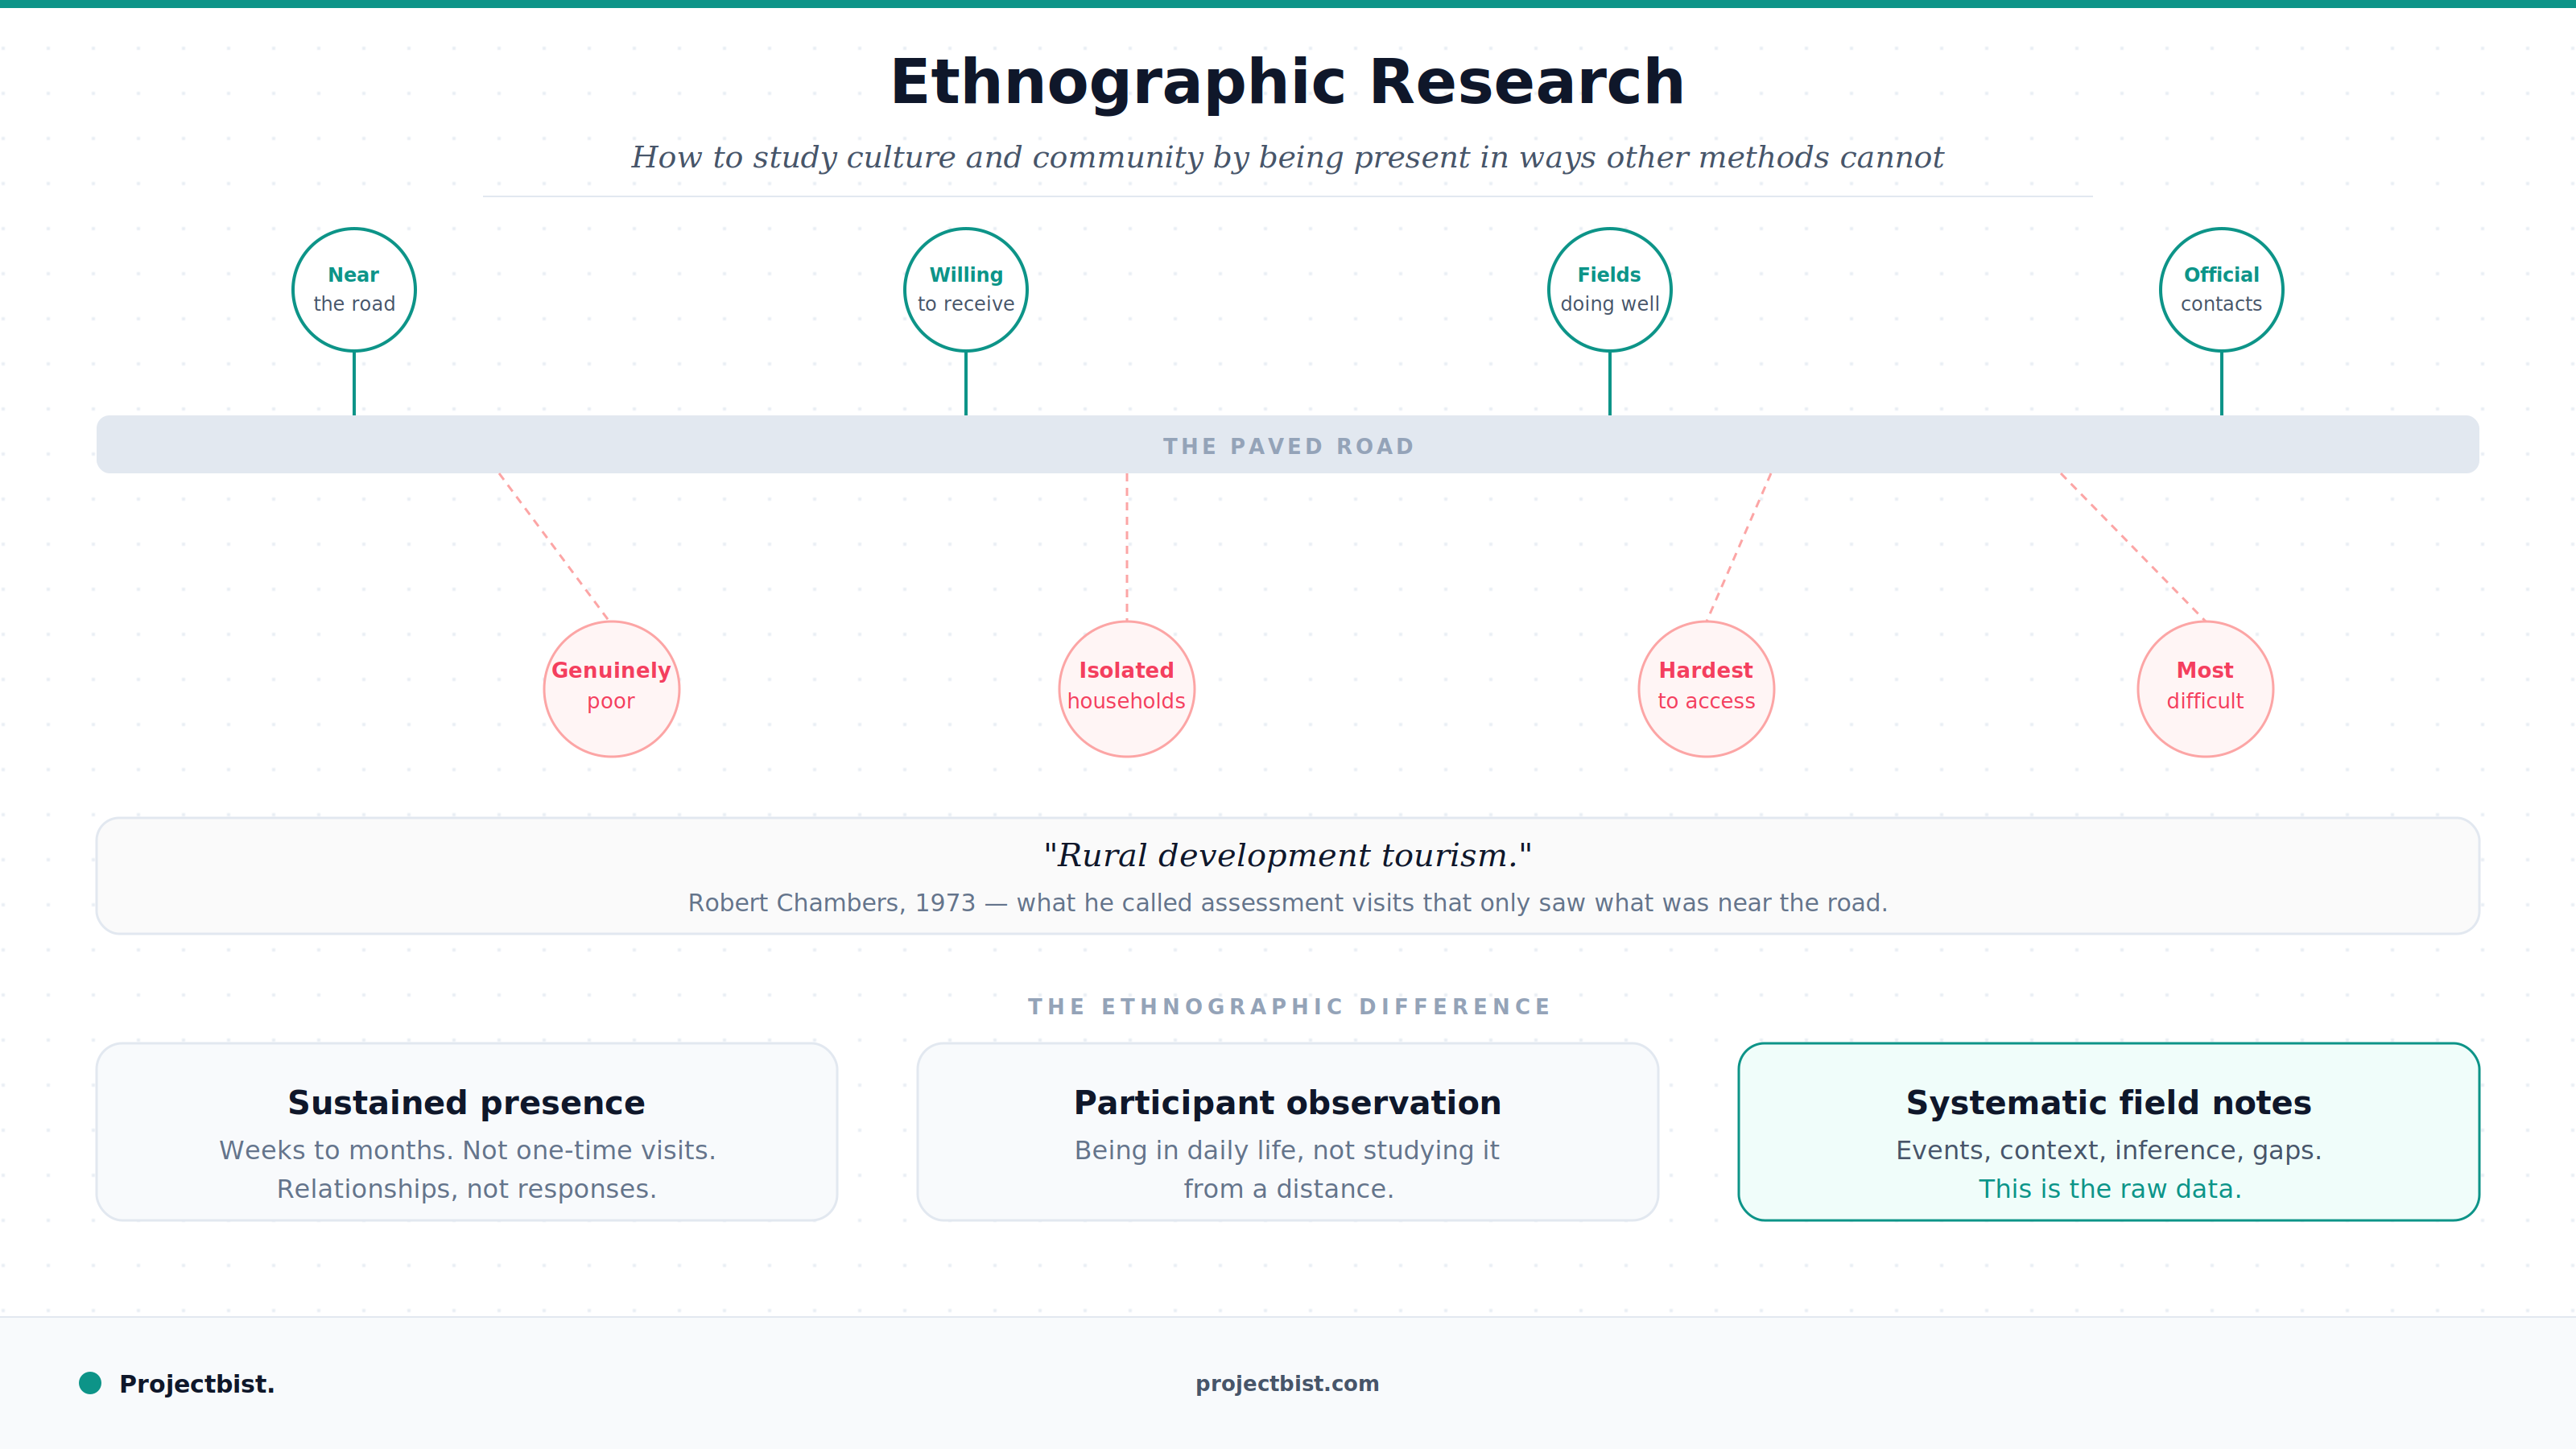
Ethnographic Research: How to Study Culture and Community by Being Present in Ways Other Methods Cannot
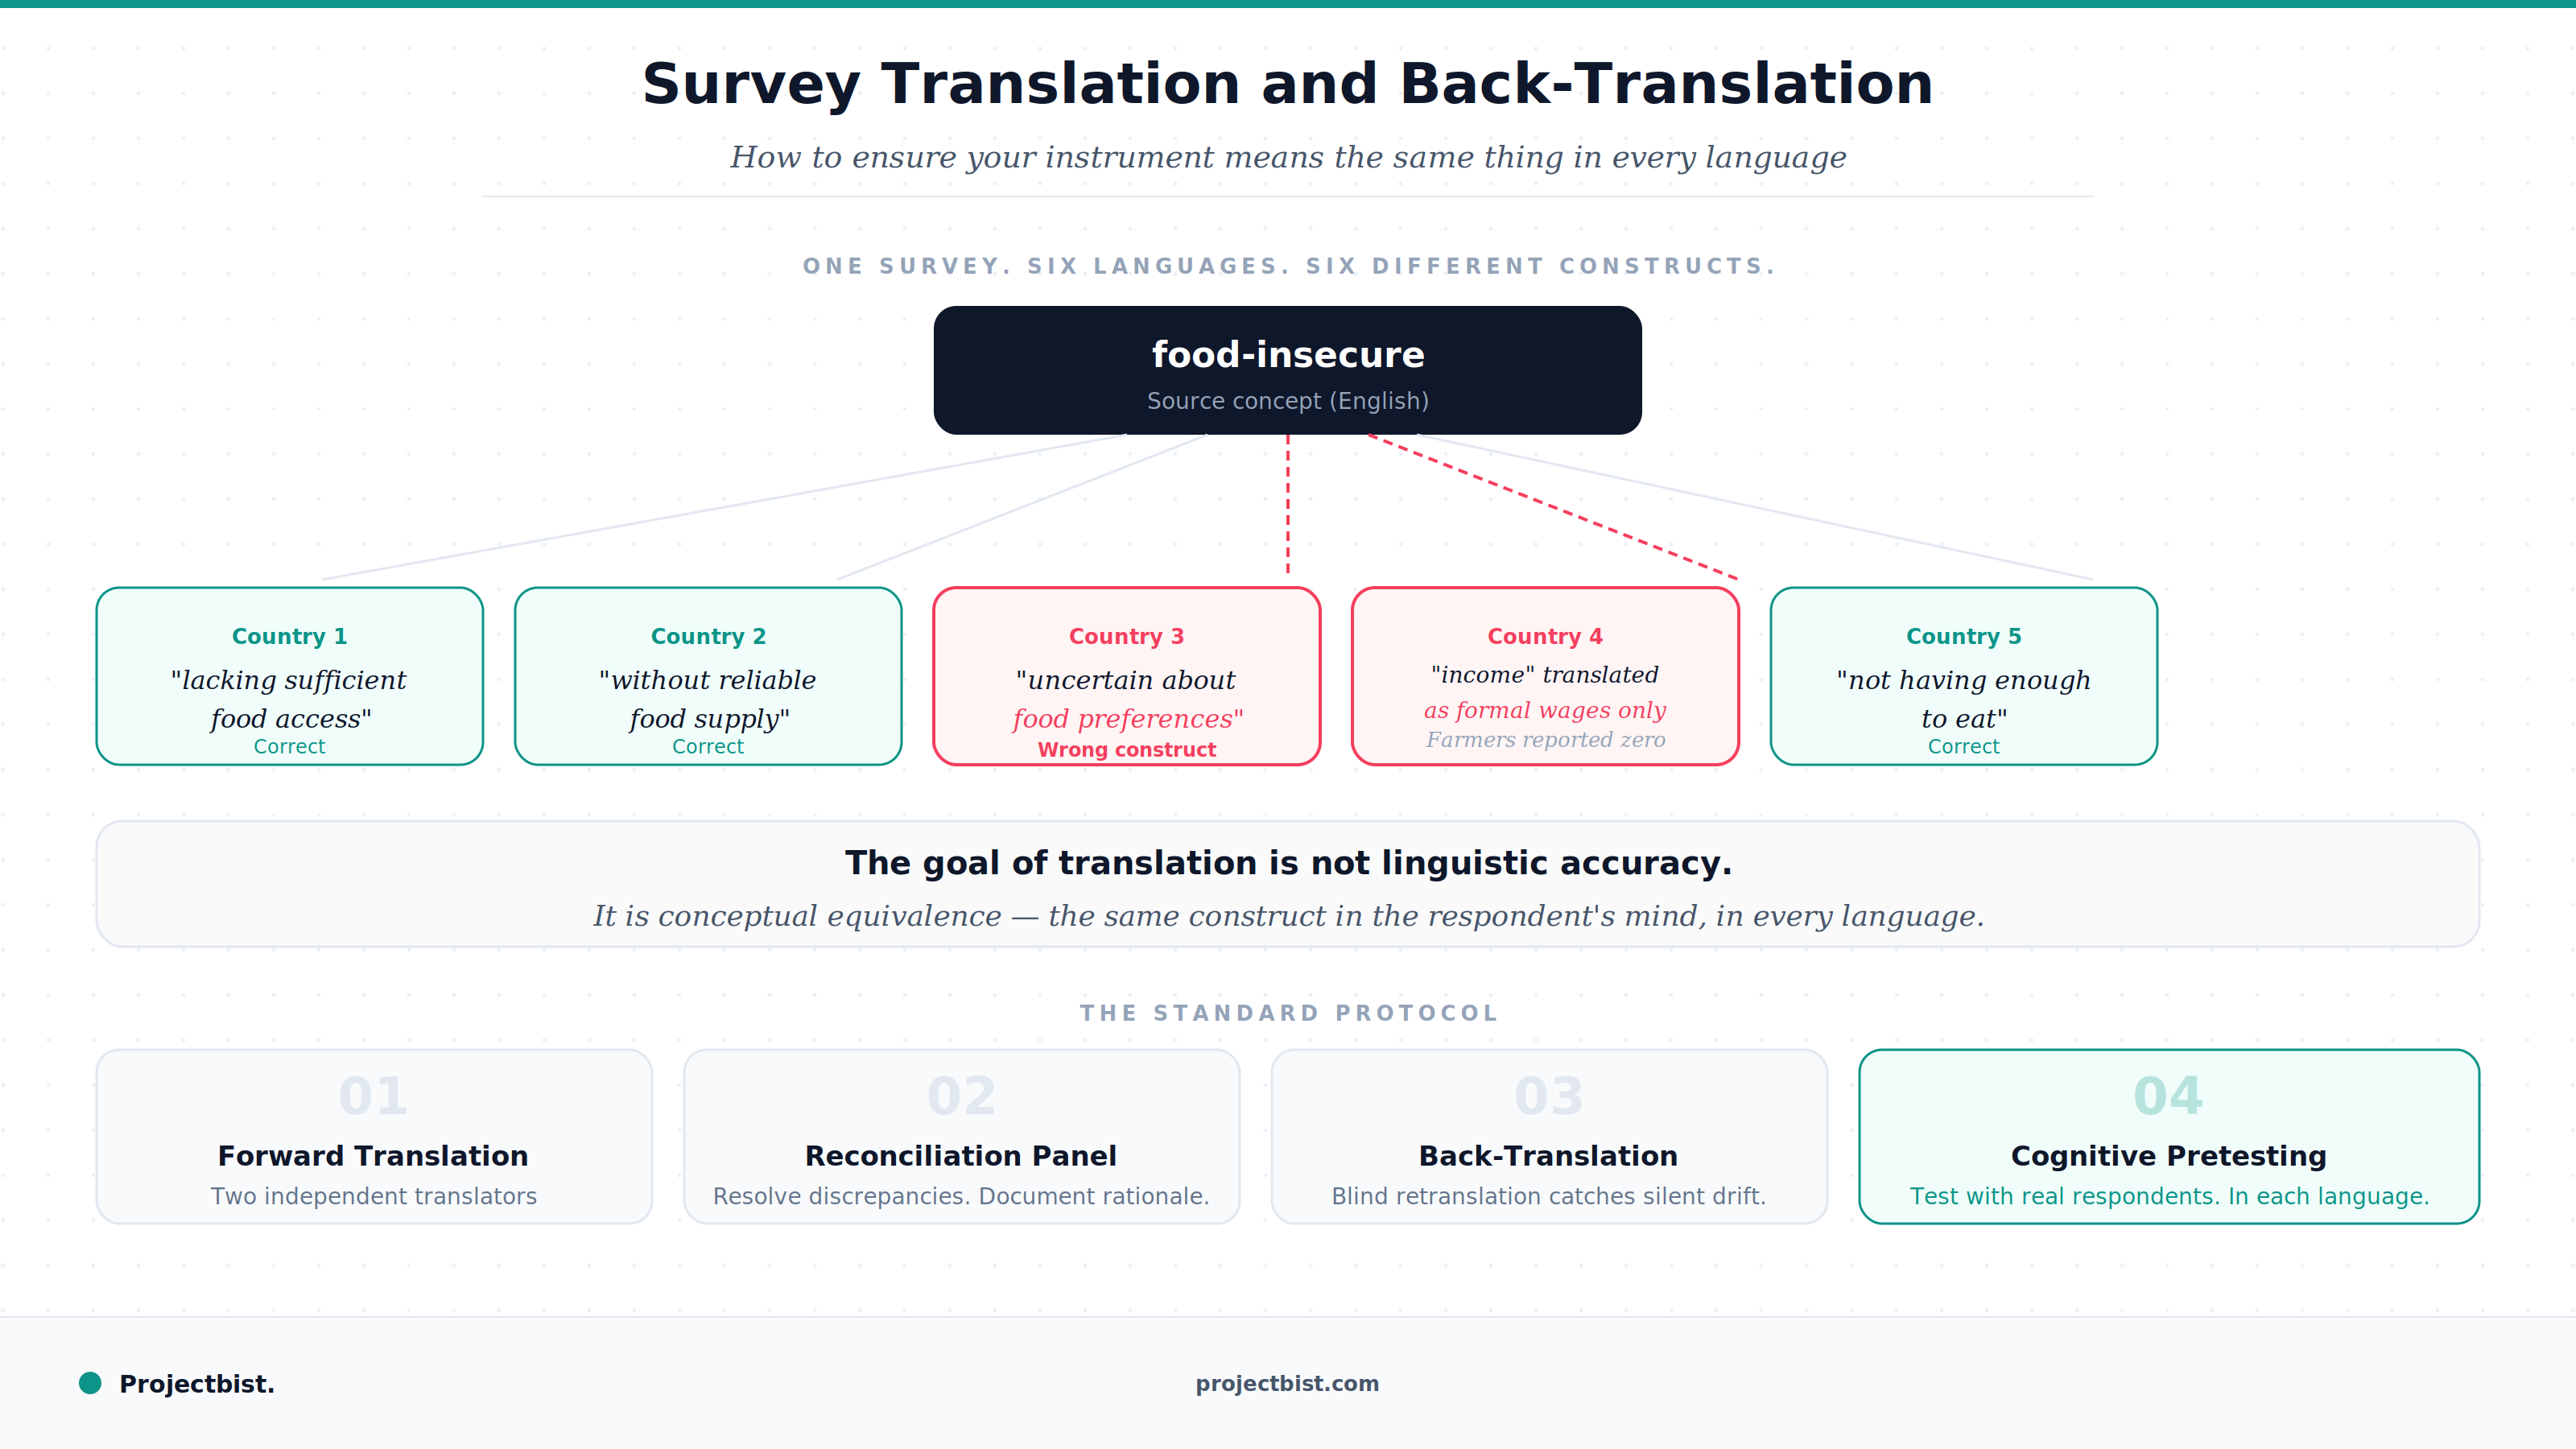
Survey Translation and Back-Translation: How to Ensure Your Instrument Means the Same Thing in Every Language
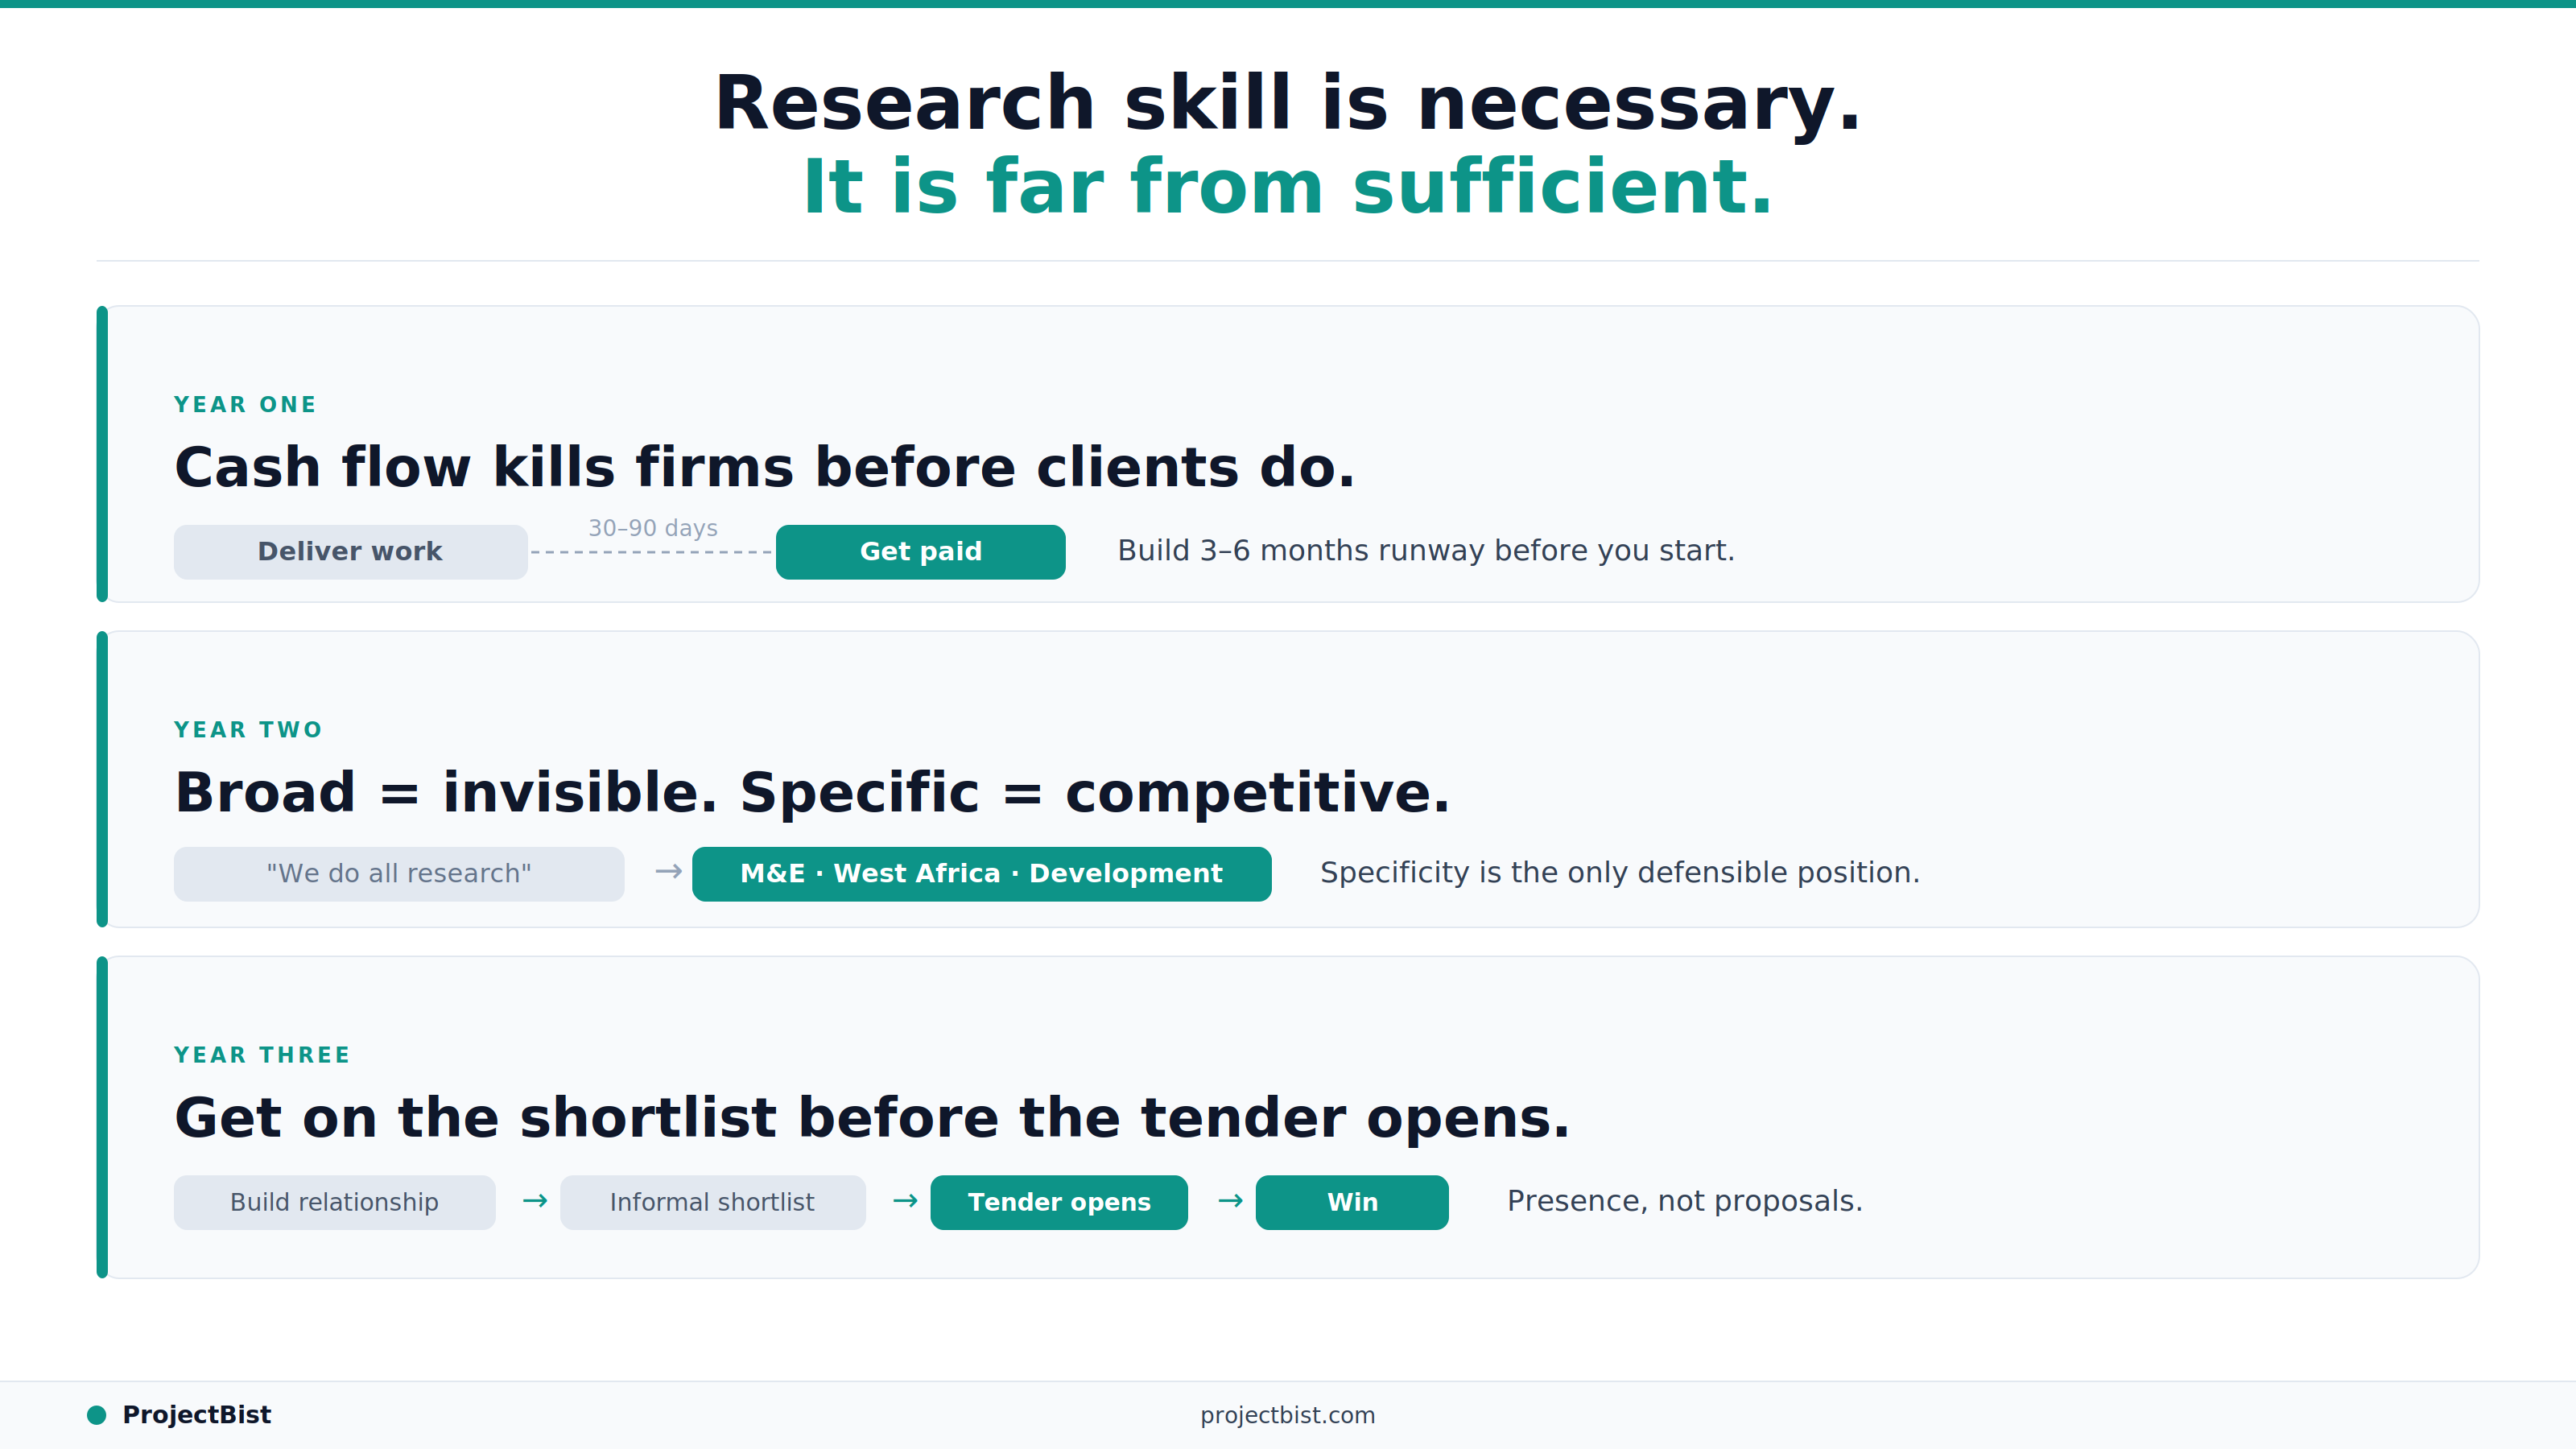
How to Build a Research Firm From Scratch: What the First Three Years Actually Require