P
Loading blog...
Loading blog...
You do not need to be an economist to use econometric methods in your research. But you do need to understand what they are measuring and where they can mislead.
Ravi Menon
May 17, 2026•4 min read
If you have worked in development, policy, or applied social research for more than a few years, you have probably encountered the phrase 'we ran a regression' in a project brief, a terms of reference, or a final report. You may have nodded along. You may have asked a follow-up question. You may have quietly decided you would figure it out later.
The later has arrived. Econometric methods are now part of the standard toolkit across evaluation research, impact assessments, market research, and social policy studies. Clients reference them in RFPs. Funders require them in evaluation frameworks. Peer reviewers expect them in published work. And the researchers who understand them, even without a graduate economics degree, are better positioned on every dimension: they write better proposals, design better studies, interpret findings more accurately, and spot methodological mistakes before they become published errors.
Econometrics is the application of statistical methods to economic and social data, with the specific goal of estimating causal relationships rather than just describing correlations. The defining challenge it addresses is one every applied researcher faces: two things appear to move together in data, but does one actually cause the other, or are they both being driven by something else?
This is the distinction between correlation and causation, made analytically tractable.
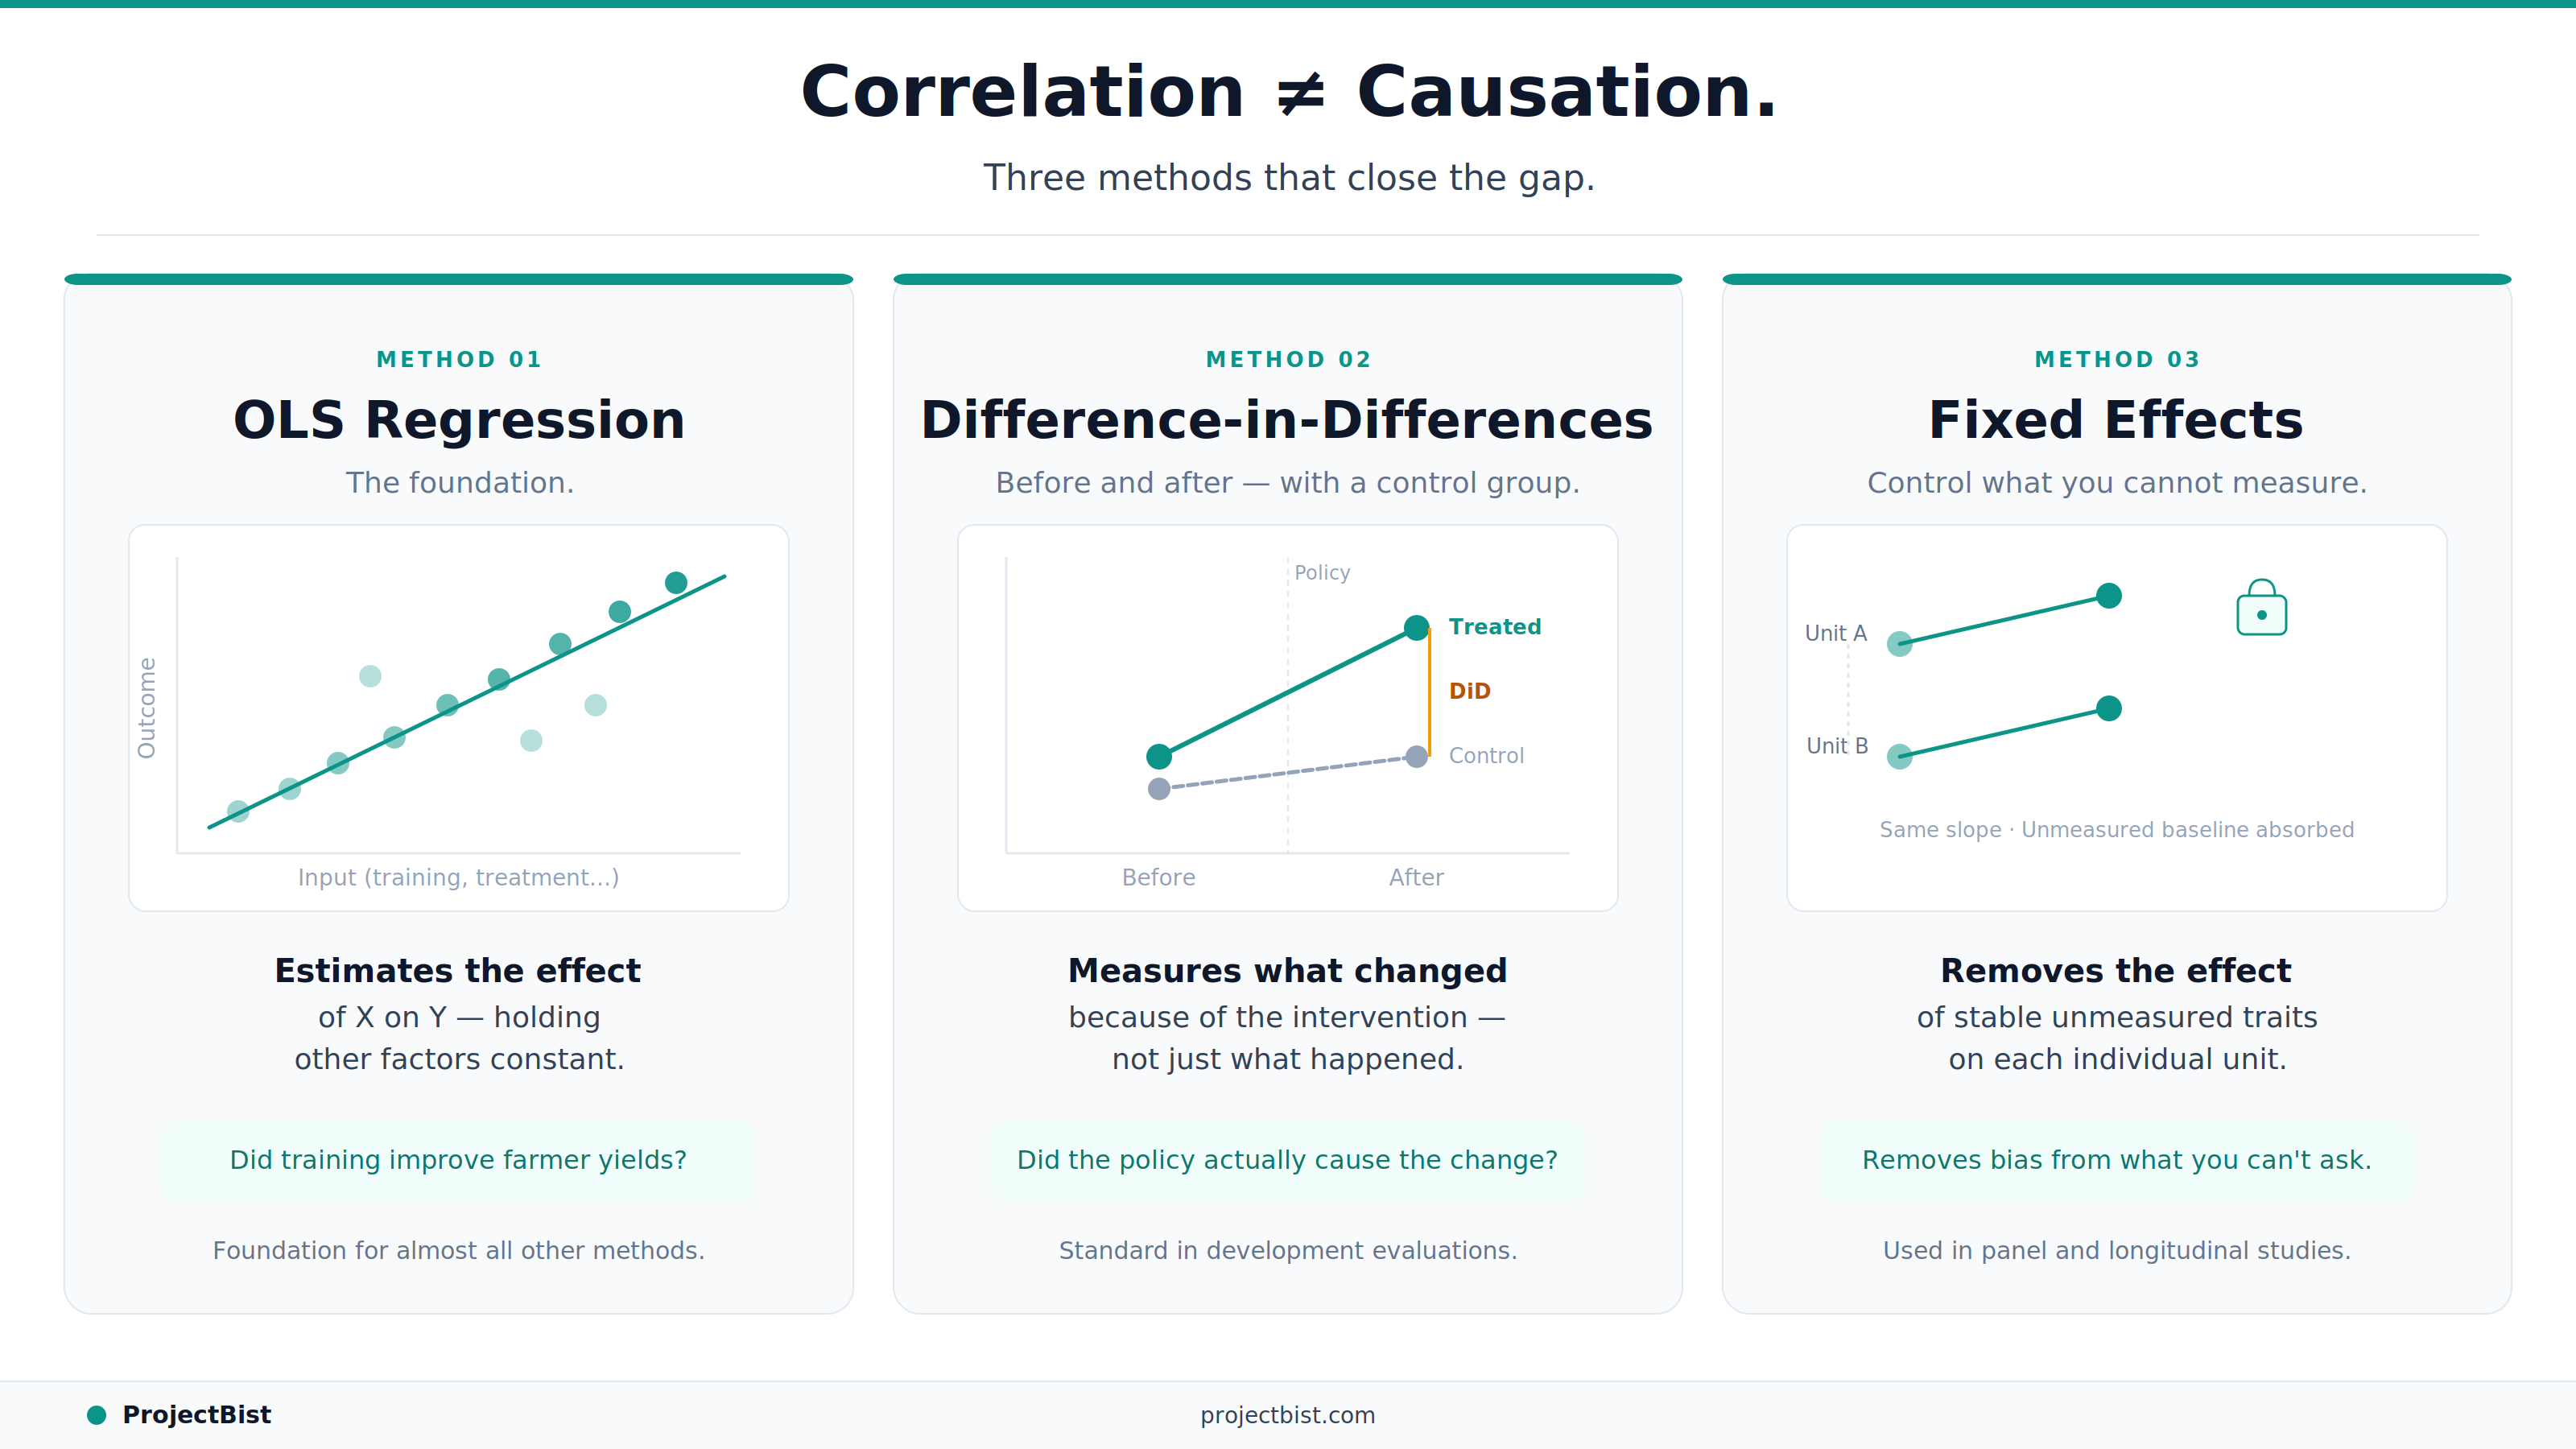
OLS regression is the most fundamental econometric method. It estimates the relationship between a dependent variable (the outcome you care about) and one or more independent variables (the factors you think affect that outcome), while holding other measured factors constant.
A simple example: you want to know whether farmers who received training in improved agricultural techniques have higher yields than those who did not. OLS allows you to estimate the training effect while controlling for farm size, soil quality, rainfall, and farmer experience. The coefficient on the training variable, if the model is correctly specified, estimates how much yield changes on average for farmers who received training versus those who did not, holding the other variables equal.
The critical assumption: the model must include all factors that both affect yields and correlate with whether someone received training. If there is a systematic difference between trained and untrained farmers that you have not controlled for, the training coefficient will be biased.
DiD is one of the most widely used quasi-experimental designs in policy and development research. It compares the change in outcomes for a group that received an intervention to the change in outcomes for a comparable group that did not.
The logic: if both groups were trending the same way before the intervention, any divergence afterward can be attributed to the intervention. This 'parallel trends' assumption is the key requirement and the main source of methodological debate in DiD applications.
DiD is the standard design for evaluating natural experiments: cases where an intervention was rolled out to some areas or groups but not others based on administrative criteria rather than random assignment.
The most important question to ask about any DiD estimate is: were the treatment and control groups really trending in parallel before the intervention? If not, the estimate is not identifying the intervention effect. It is identifying a pre-existing difference.
A fixed effects model controls for all time-invariant characteristics of the unit of observation, even those you did not or cannot measure. If you are studying outcomes across 50 households over three years, a household fixed effects model removes the influence of all stable household characteristics, observed or unobserved, from the estimate.
This is powerful because many of the factors that confound research findings are characteristics of places or people that are stable over time. Geography, culture, institutional quality, individual ability: all of these can be controlled for through fixed effects without needing to measure them.
Endogeneity occurs when the treatment variable you are studying is itself affected by the outcome you are measuring, creating a circular relationship that OLS cannot disentangle. IV methods address this by finding a variable (the instrument) that affects treatment uptake but has no direct effect on the outcome.
A classic example: studying the effect of education on earnings, where people with higher earnings also tend to invest more in education. A researcher might use proximity to a school as an instrument: distance to school affects whether someone completes education but is unlikely to directly affect earnings independent of that channel.
IV is powerful when it works. Finding a genuinely valid instrument is the hard part, and invalid instruments can produce estimates that are more biased than OLS, not less.
What statistical software do I need to run these methods?
Stata is the most widely used tool for applied econometrics in development and policy research. R with the lm() and plm packages is a free, increasingly popular alternative. Python with statsmodels is also used but less standard in social science contexts. SPSS supports basic OLS regression but is less capable for the more complex designs.
What is the difference between fixed effects and random effects?
Fixed effects assumes that the unobserved individual or group characteristics are correlated with the independent variables. Random effects assumes they are not. The Hausman test is the standard method for determining which assumption is appropriate for a given dataset.
How do I know if my regression results are reliable?
Beyond significance testing: check that the coefficient signs make theoretical sense, report confidence intervals not just p-values, test for multicollinearity among independent variables, and check whether results change substantially when you add or remove control variables. Robustness checks are the practical evidence that results are not artefacts of model specification.
Newsletter
Personalize your updates! Subscribe to ProjectBist's Newsletter and choose from the following categories.
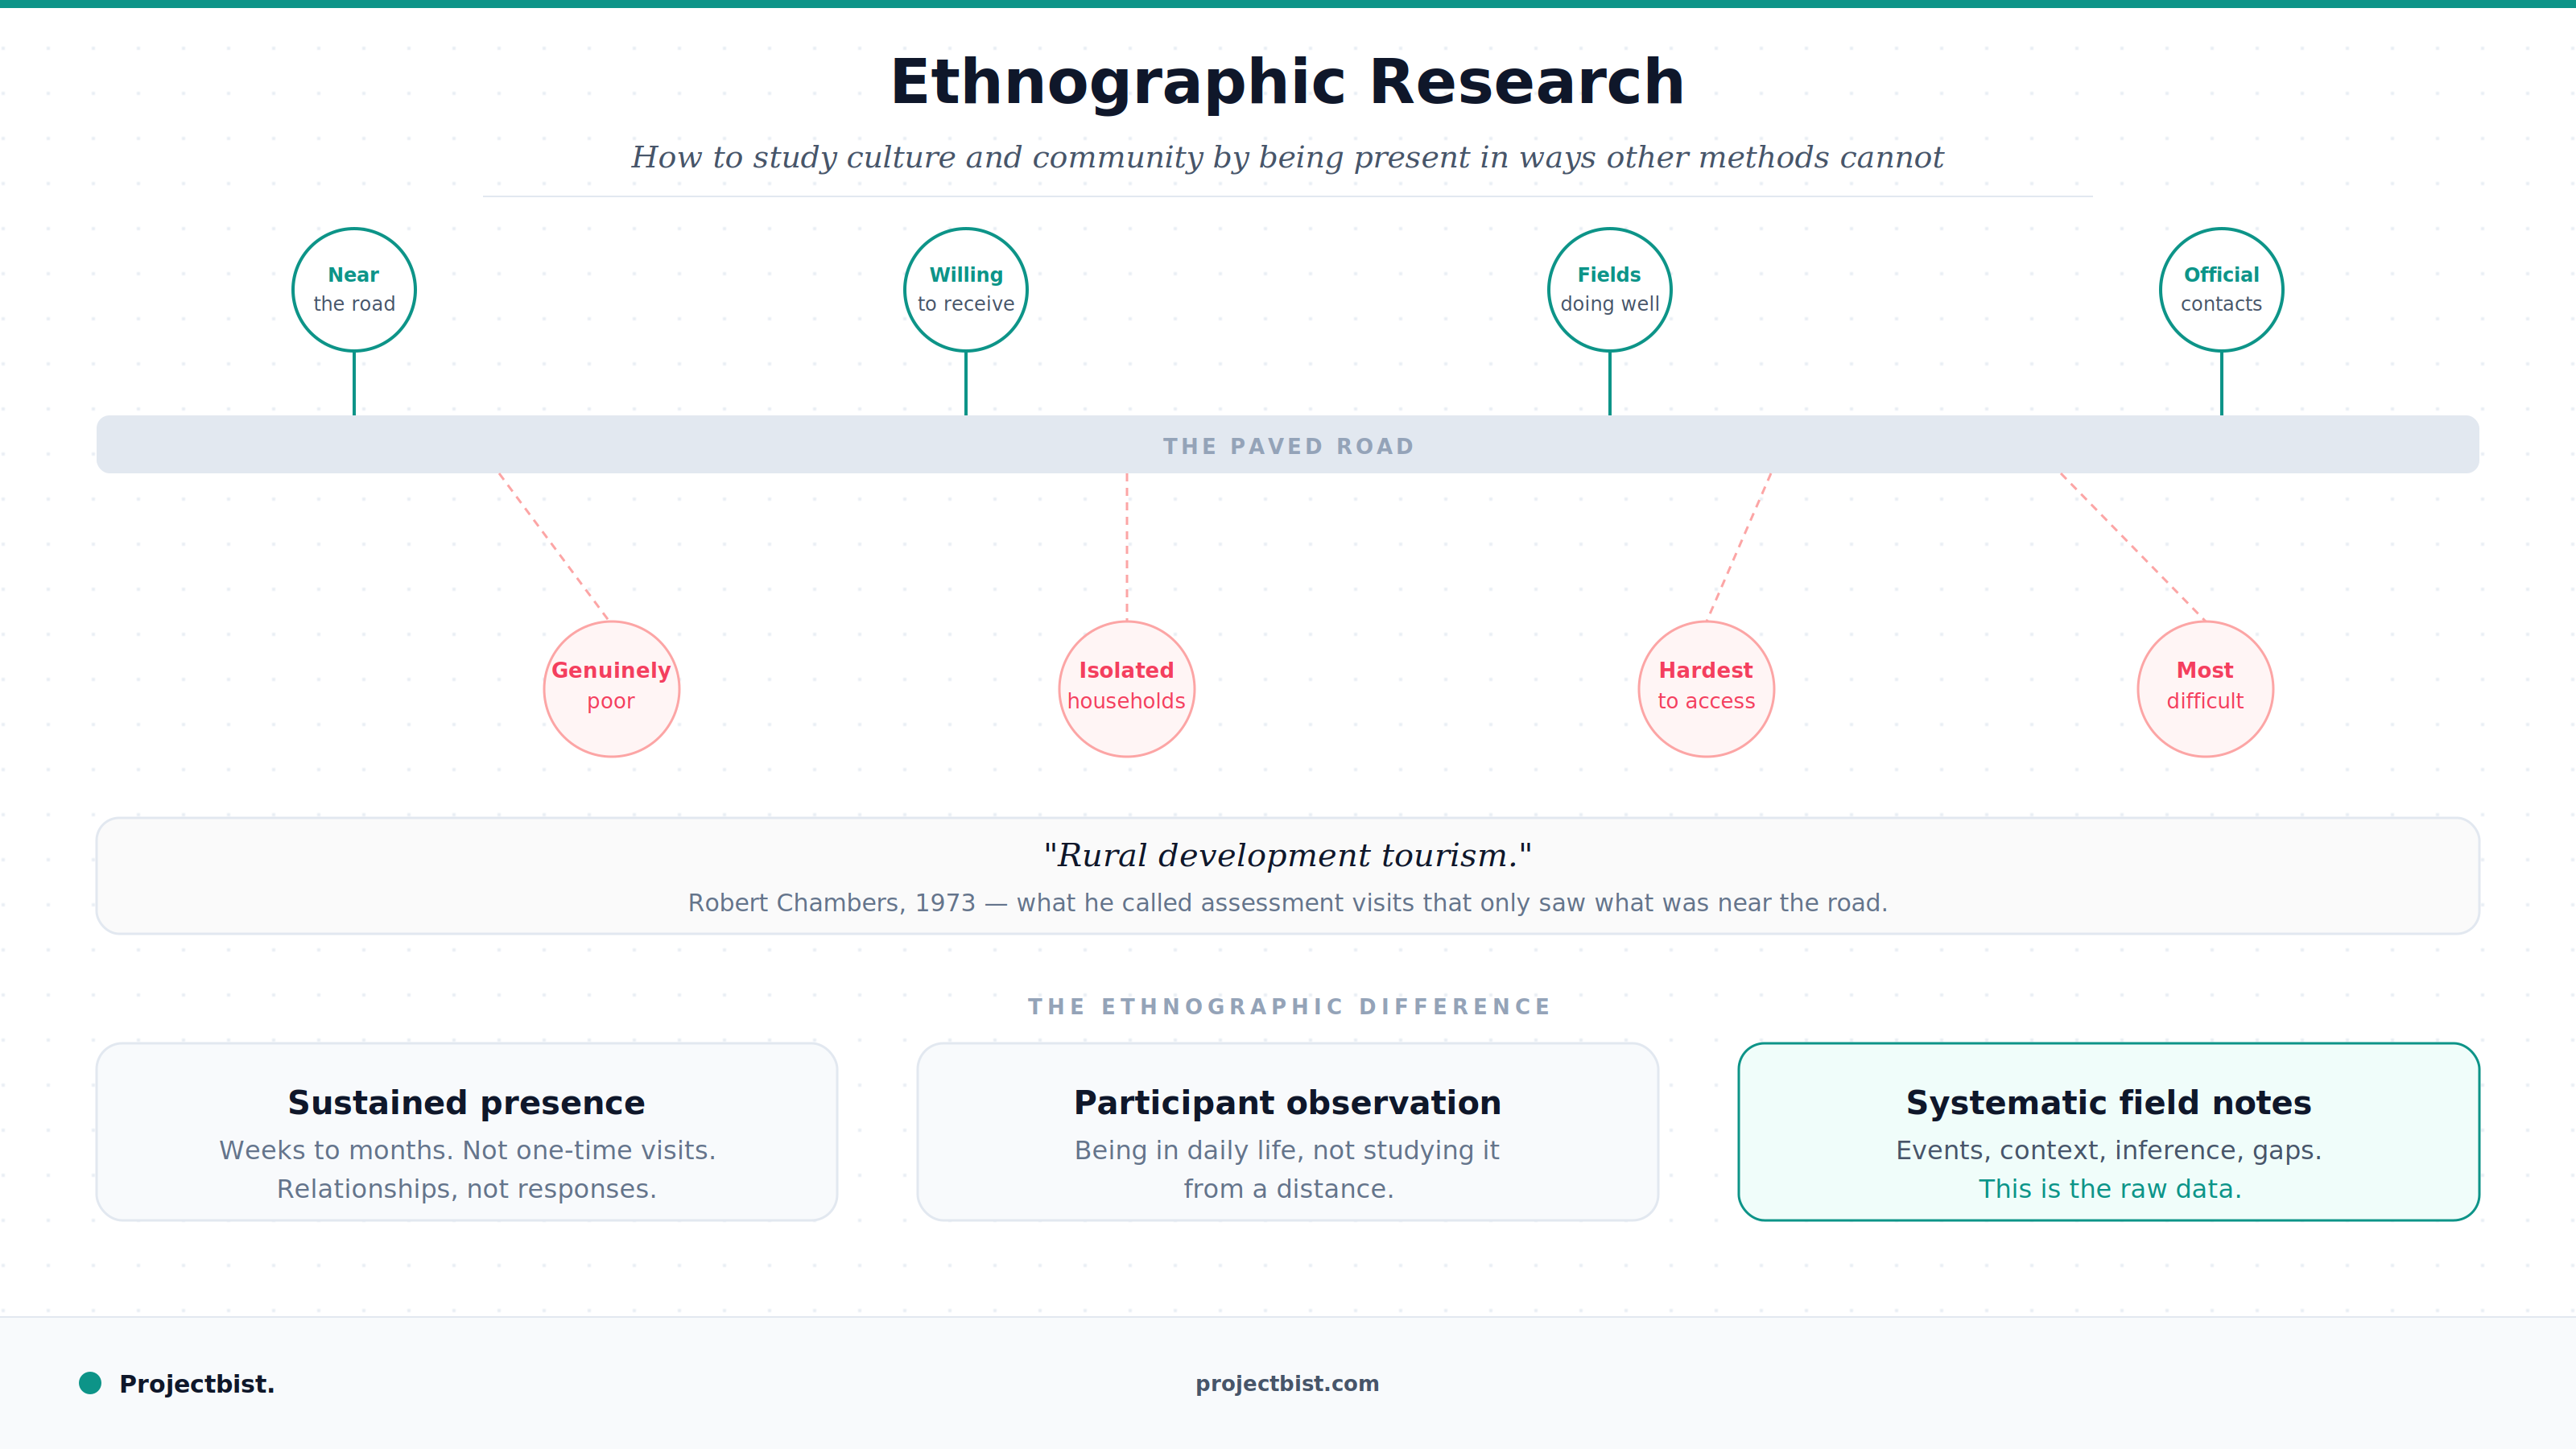
Ethnographic Research: How to Study Culture and Community by Being Present in Ways Other Methods Cannot
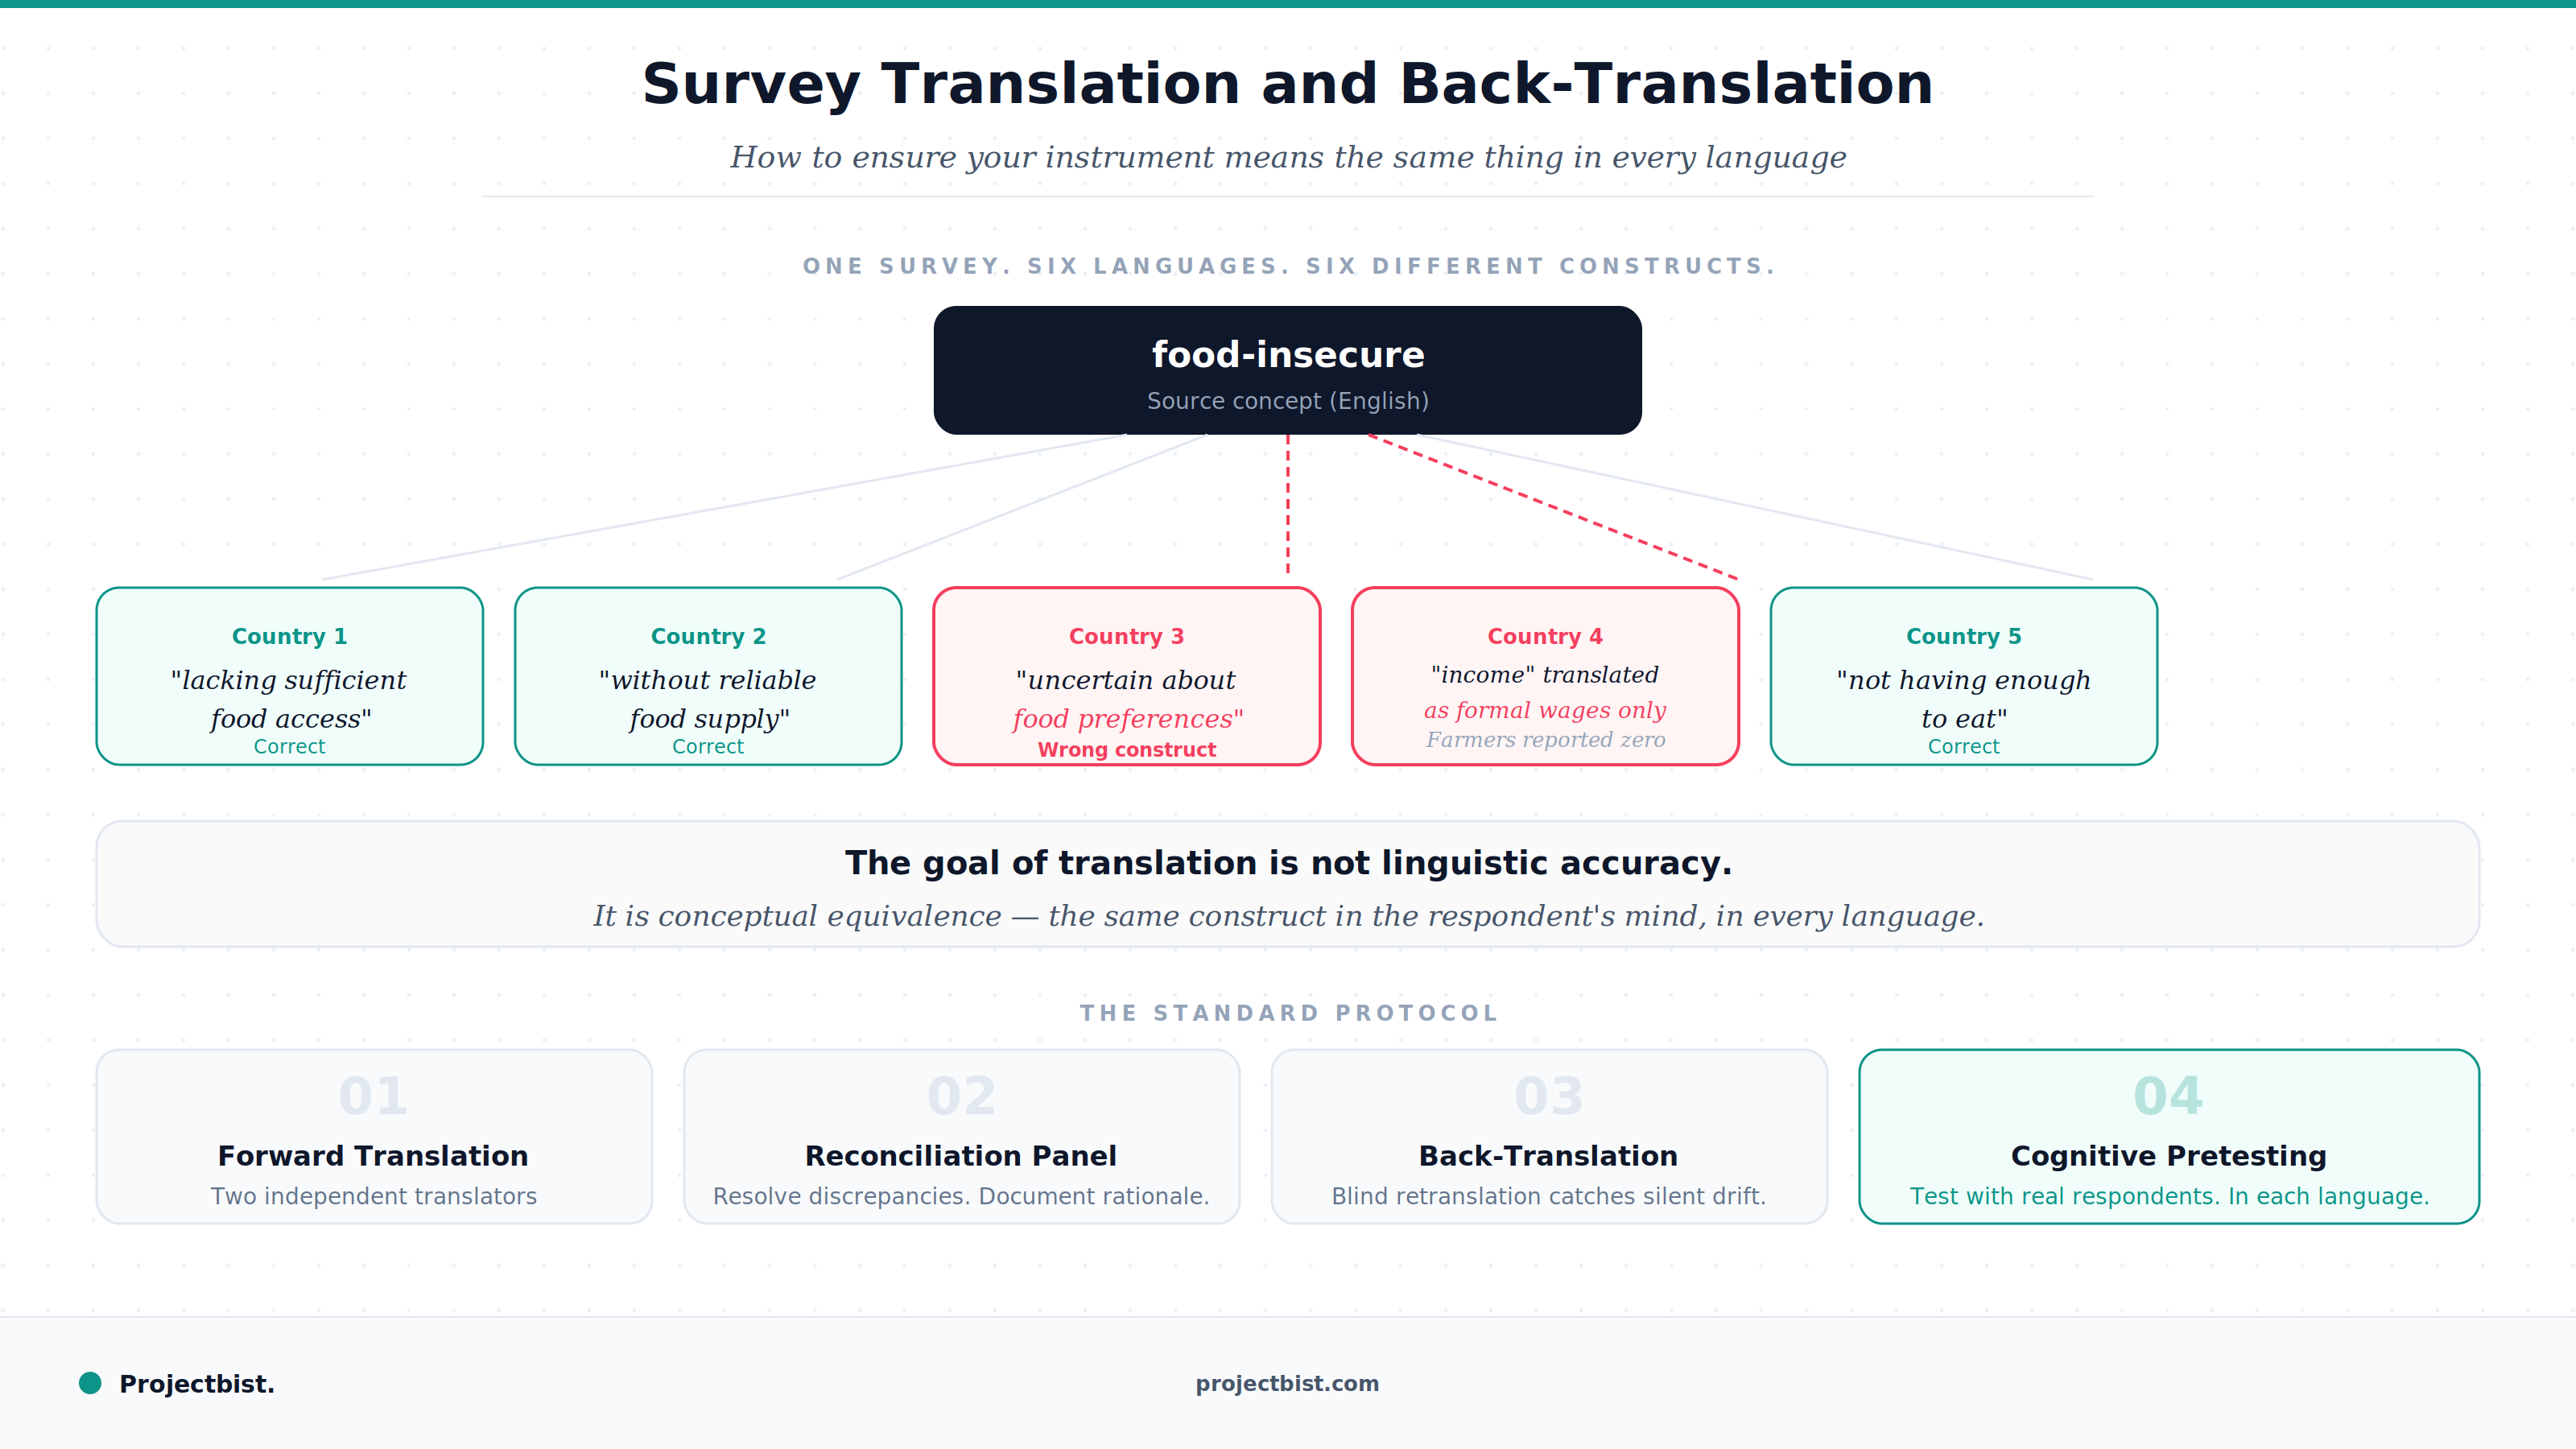
Survey Translation and Back-Translation: How to Ensure Your Instrument Means the Same Thing in Every Language

How to Build a Research Firm From Scratch: What the First Three Years Actually Require