P
Loading blog...
Loading blog...
NPS is one of the most used metrics in customer research and one of the most misapplied. Here is how to use it properly.
Luis Ortega
May 06, 2026•5 min read
NPS has one of the most interesting stories in market research. It started as a simple question: how likely are you to recommend us to a friend or colleague? It was published in the Harvard Business Review in 2003 by Fred Reichheld at Bain and Company with the claim that it was the single best predictor of company growth. The research world adopted it at extraordinary speed. Within a decade, it was embedded in CX programs at thousands of companies globally.
It is also one of the most argued-about metrics in the industry. The original growth correlation claim has been challenged by multiple independent studies. Yet NPS persists, because despite its limitations, when used correctly and in context, it provides a genuinely useful lens on customer loyalty.
Here is what it is, how to calculate it properly, and what to do about what you find.
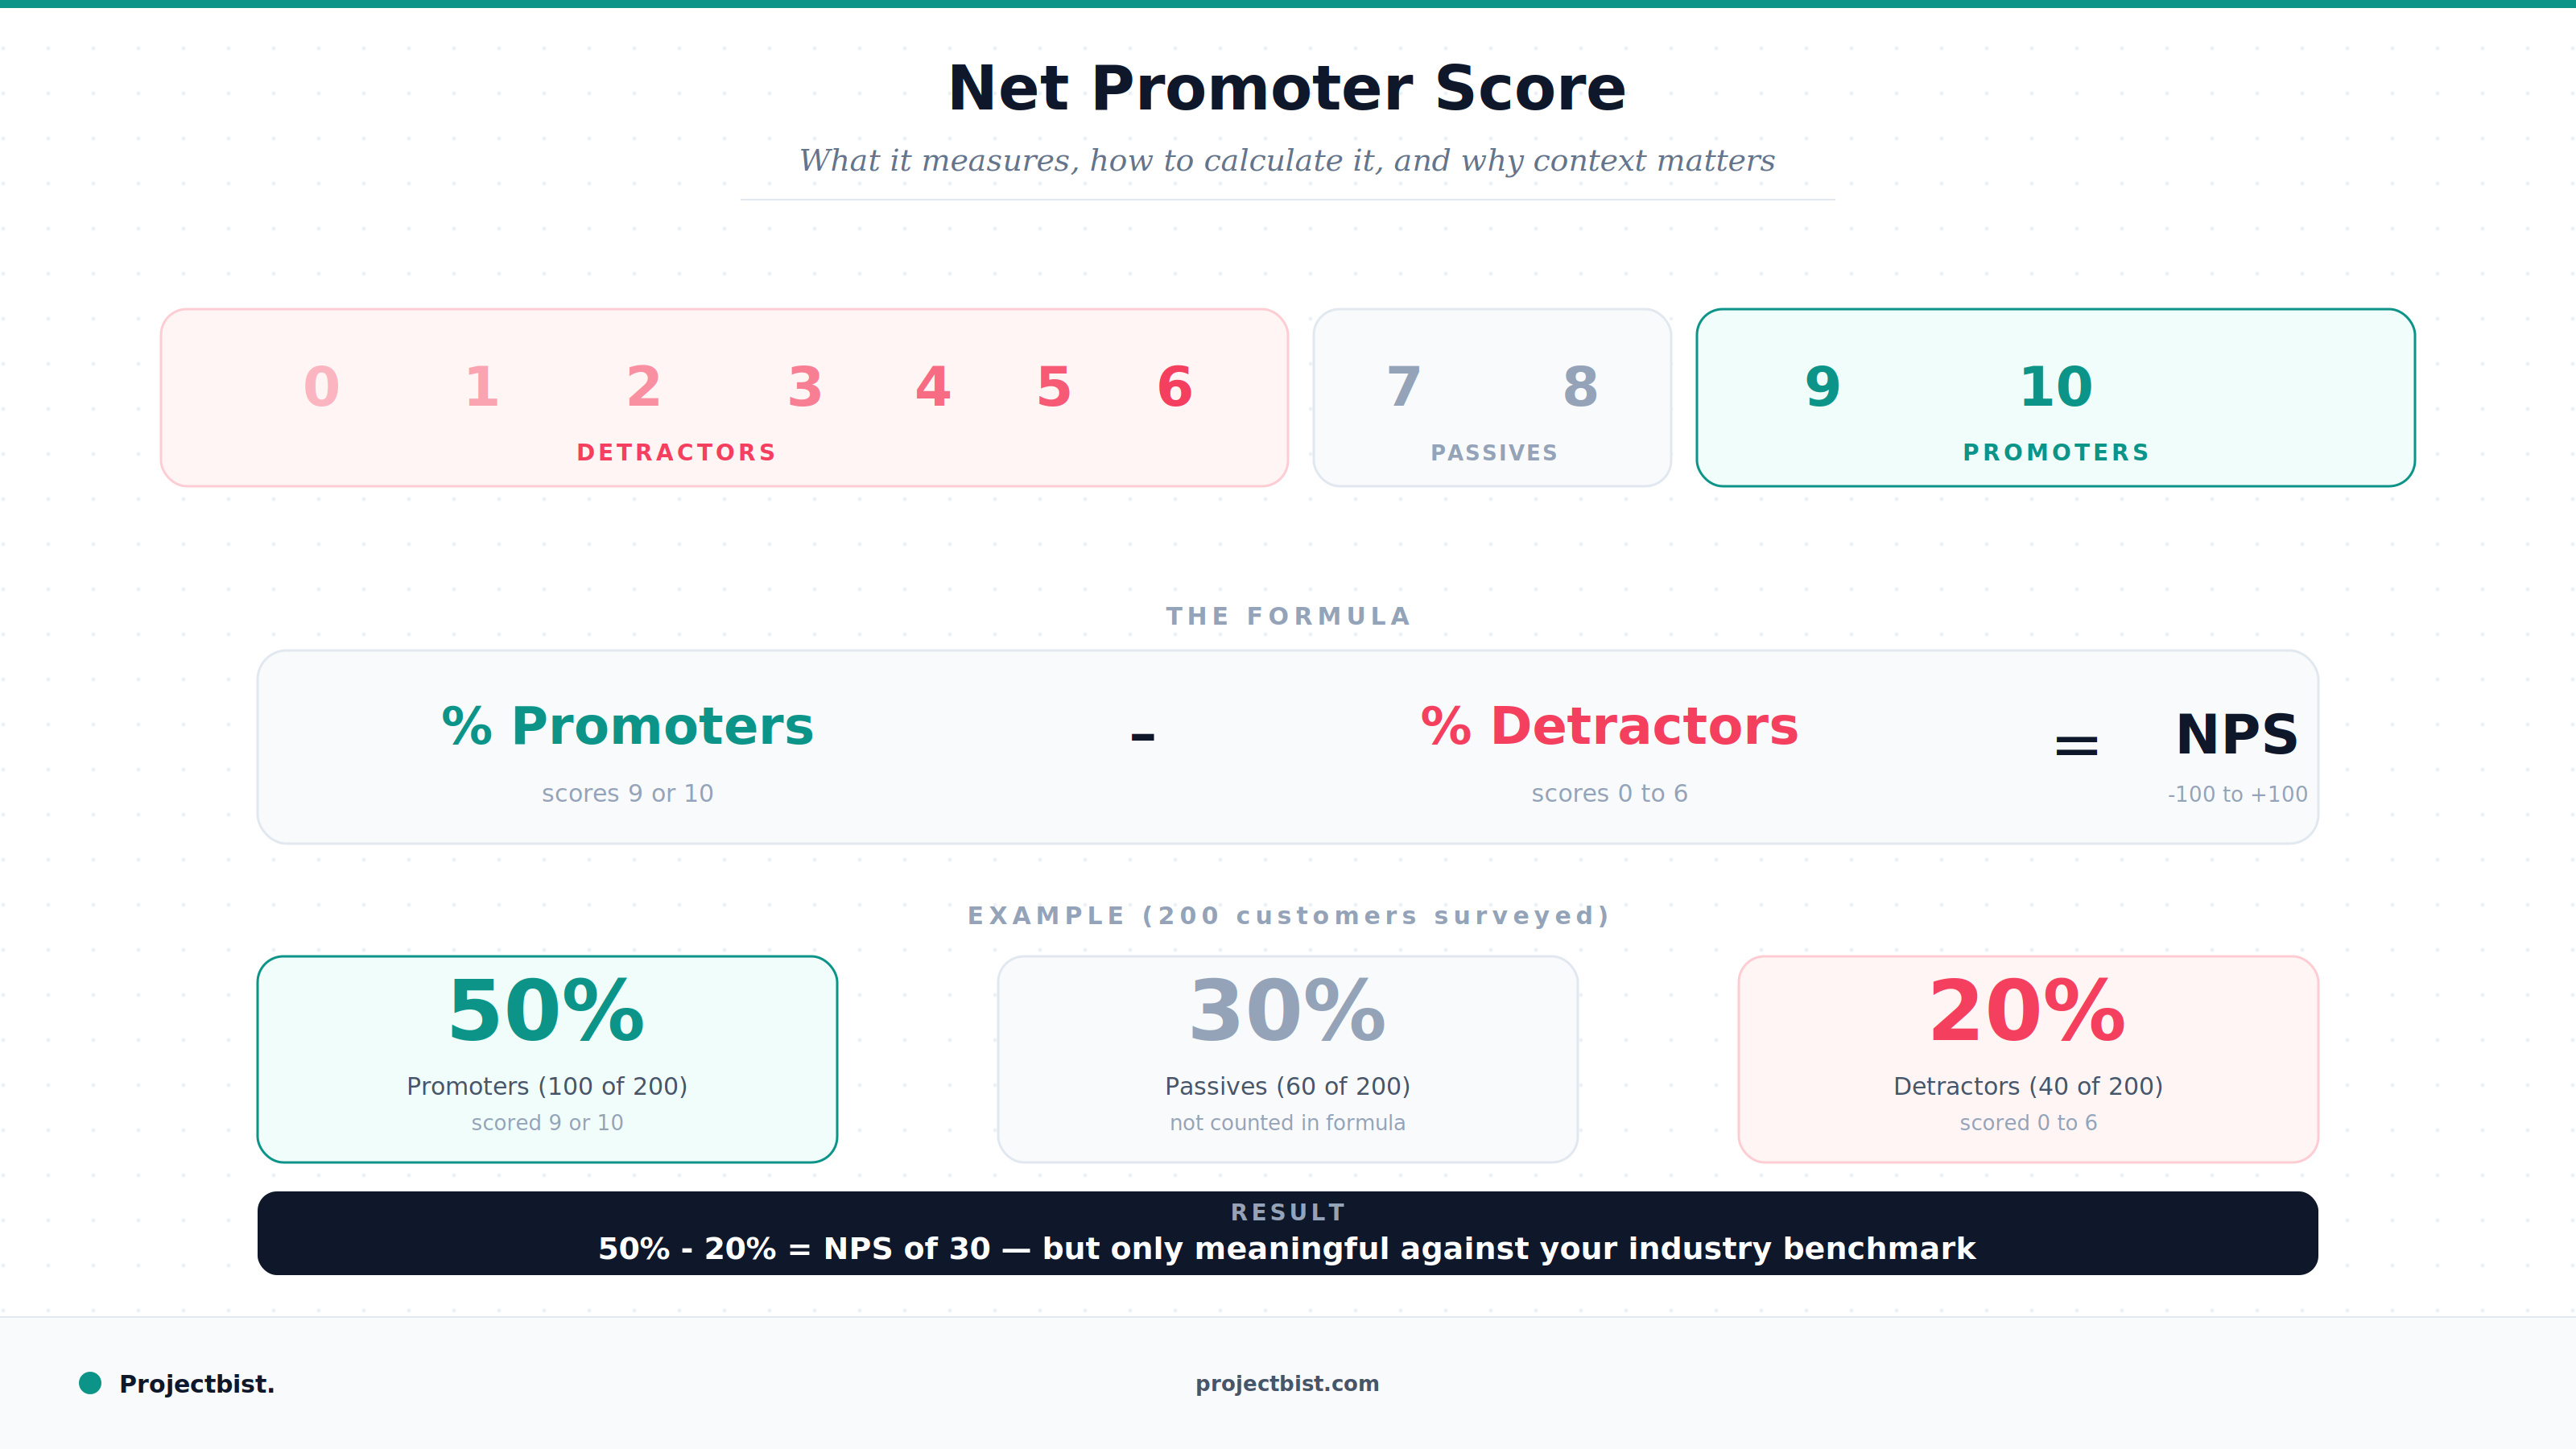
NPS is derived from a single question asked on a 0 to 10 scale: On a scale of zero to ten, how likely are you to recommend us to a friend or colleague?
Respondents are then sorted into three groups:
NPS = % Promoters minus % Detractors
The result is expressed as a number between -100 (everyone is a detractor) and +100 (everyone is a promoter). Passives are excluded from the formula entirely but included in the denominator when calculating percentages.
Example: You survey 200 customers. 100 score 9 or 10 (Promoters = 50%). 60 score 7 or 8 (Passives = 30%, not included in formula). 40 score 0 to 6 (Detractors = 20%). NPS = 50 minus 20 = 30.
An NPS of 30 is not intrinsically good or bad. It depends entirely on your industry benchmark, your own historical trend, and what your competitors are scoring.
NPS scores vary enormously by industry. According to Qualtrics XM Institute data, the grocery industry average is around 30, video streaming around 29, and consumer payments around -6. A score of 20 in consumer payments is genuinely strong. The same score in a premium consumer goods brand is a warning signal.
A single NPS score is almost meaningless in isolation. Its value comes from tracking it over time. Is it rising or falling? What correlates with the changes? A score that dropped 8 points in a quarter needs an explanation rooted in operational events, not just a target to recover it.
Aggregate NPS hides important variation. A brand might score 45 overall while scoring 15 among first-time buyers. The problem is not with loyal customers. It is with onboarding. Segmenting NPS by customer cohort, tenure, product type, or geographic region surfaces the operational story behind the number.
Academic research has consistently challenged the claim that NPS is the single best predictor of growth. A landmark study by Keiningham et al. published in the Journal of Marketing found that NPS performed no better than other satisfaction metrics in predicting revenue growth. This does not invalidate NPS as a useful operational metric. It does mean it should not be treated as a uniquely authoritative growth indicator.
Relational NPS is measured periodically across the full customer base, independent of any specific interaction. It tracks overall brand loyalty and is used for strategic benchmarking.
Transactional NPS is triggered immediately after a specific interaction: a purchase, a support call, a delivery. It measures the quality of a specific touchpoint and is used for operational improvement.
Most CX programs use both. Relational NPS tells you where you stand. Transactional NPS tells you which touchpoints are creating or destroying promoters.
What is a good NPS score?
It depends on your industry. Scores above 0 mean you have more promoters than detractors. Scores above 50 are generally considered excellent. But the most meaningful benchmark is your own historical trend and your industry average. A score of 20 is good in some sectors and poor in others.
How often should NPS be measured?
Relational NPS is typically measured quarterly or annually. Transactional NPS can be measured continuously, triggered after key customer interactions. FMCG brands often track quarterly; financial services and SaaS companies often run always-on transactional tracking.
Should I include NPS as part of a larger customer survey?
Yes. NPS in isolation tells you the score but not the cause. Including open-text follow-up questions, CSAT for specific attributes, and customer effort score alongside NPS gives you the diagnostic power to understand and act on the number.
Newsletter
Personalize your updates! Subscribe to ProjectBist's Newsletter and choose from the following categories.
Ethnographic Research: How to Study Culture and Community by Being Present in Ways Other Methods Cannot
Survey Translation and Back-Translation: How to Ensure Your Instrument Means the Same Thing in Every Language
How to Build a Research Firm From Scratch: What the First Three Years Actually Require