P
Loading blog...
Loading blog...
Data cleaning is where most research quality is either protected or lost. Here is how to do it systematically before a single analysis runs.
Chloe Dubois
Apr 10, 2026•4 min read
Every researcher knows data cleaning needs to happen. Fewer researchers have a consistent, documented process for doing it before they begin analysis.
The result is that cleaning decisions get made on the fly, in the middle of analysis, when the pressure to produce findings is high and the time for careful judgment is low. Outliers get removed or kept based on what makes the story cleaner. Missing data gets handled inconsistently. And the findings that come out are built on a foundation that nobody can audit or reproduce.
Data cleaning is not a creative task. It is a systematic one. It should happen before the analysis phase begins, according to a documented protocol that was decided before the data was collected — not after.
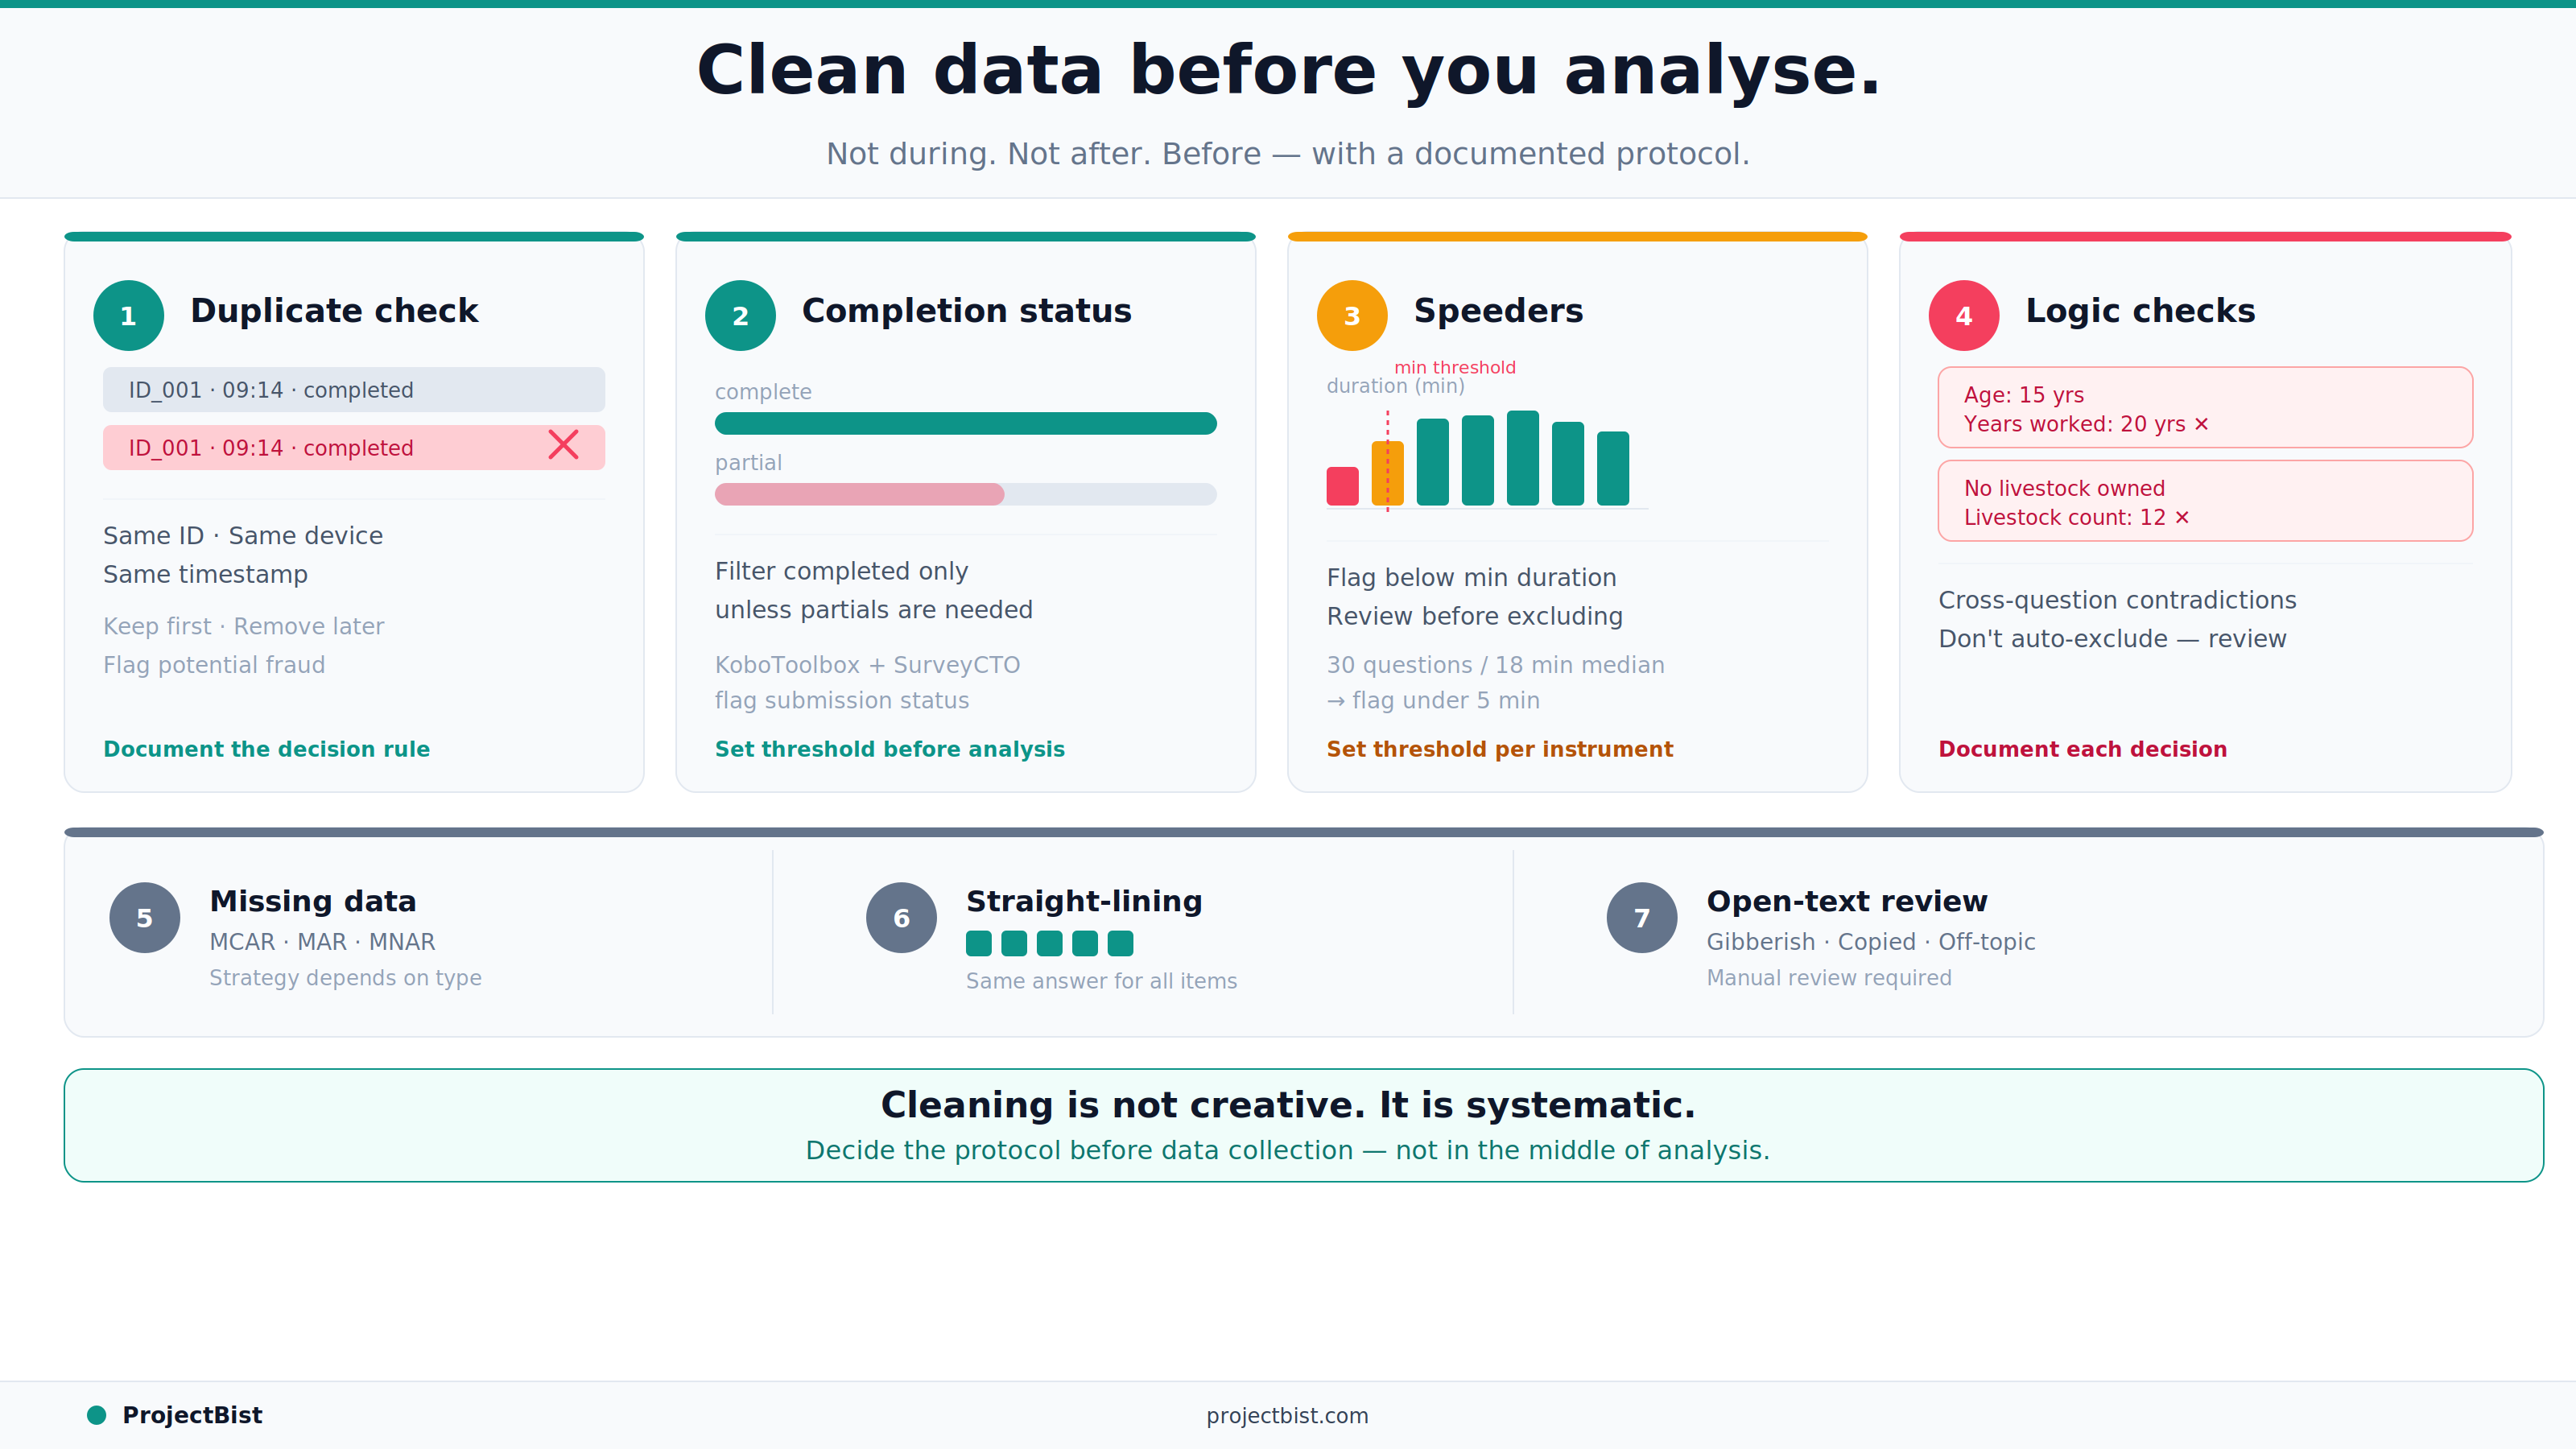
Run a check for duplicate respondent IDs, duplicate device fingerprints, or duplicate submission timestamps. In online surveys, the same person can often complete a survey multiple times if incentives are involved. In CAPI or CATI fieldwork, duplicate records can indicate data entry errors or, in some cases, enumerator fraud.
Decision rule: remove the later duplicate and retain the first submission, unless there is evidence that the first submission was incomplete or technically corrupted.
Filter for completed surveys only, unless your analysis explicitly requires partial completions. For digital surveys, platforms like KoboToolbox and SurveyCTO flag submission status. For web surveys, completion is typically defined by reaching the last page or a specific end marker. Decide the completion threshold before running analysis and document it.
Calculate the interview duration for each submission (available in the metadata for most digital survey platforms). Set a minimum plausible duration based on the number of questions and the expected average interview time. Submissions completed faster than this threshold should be flagged as speeders and reviewed before a decision is made to include or exclude them.
Rule of thumb: a survey with 30 questions and a median completion time of 18 minutes should flag anything completed in under 5 minutes. The exact threshold should be set based on the specific survey instrument, not a generic rule.
Run consistency checks across questions that should logically relate. Some examples:
These logical contradictions do not automatically mean the record should be removed, but they require review. In some cases they indicate an error in one question. In others they indicate the record should be excluded. Document the decision for each case.
Missing data in survey research falls into three categories: Missing Completely at Random (MCAR), Missing at Random (MAR), and Missing Not at Random (MNAR). The appropriate handling strategy differs by category.
For MCAR: listwise deletion (excluding the whole record from analysis) is defensible if the proportion of missing data is small (under 5 percent is a common rule of thumb).
For MAR: imputation methods such as mean substitution, regression imputation, or multiple imputation can be used. The choice depends on the severity of missingness and the nature of the analysis.
For MNAR: no statistical fix fully addresses the bias introduced by non-random missingness. In this case, the limitation should be explicitly reported in the methodology section.
In matrix or grid questions, straight-lining means selecting the same response option for every row regardless of the question content. Run a check for respondents who selected identical responses across all items in every matrix question in the survey. Flag these records for review — they typically indicate low engagement or automated response patterns.
If the survey includes open-ended questions, review a sample of responses before finalizing the clean dataset. Look for nonsensical text, single characters, AI-generated pattern text, or off-topic responses that suggest the respondent was not genuinely engaging with the survey. This step is qualitative and judgment-based but catches quality issues that quantitative checks miss.
For every cleaning decision made — how duplicates were handled, what the speeder threshold was, how missing data was treated — create a data cleaning log. This log should be attached to the final dataset. It enables peer review, replication, and transparent reporting of the study's limitations. A clean dataset without a cleaning log is a dataset that cannot be properly evaluated.
What percentage of data can I exclude before it affects the validity of findings?
There is no universal rule, but exclusion rates above 15 to 20 percent of the raw sample should trigger a serious review of whether the data collection process had systemic problems. Document the exclusion rate and the reasons in the methodology section regardless of the percentage.
Should I remove outliers in survey data?
Outliers should be investigated, not automatically removed. First determine whether the outlier is the result of a data entry error (in which case correct it or remove it), a legitimate extreme response (in which case retain it), or a fraudulent or inattentive response (in which case apply your exclusion criteria consistently). Removing outliers to improve the appearance of results is not defensible.
What tools are best for data cleaning in survey research?
For basic cleaning, Excel or Google Sheets is sufficient for small datasets. For larger datasets, R or Python with pandas offer more efficient and reproducible cleaning workflows. Stata and SPSS both include data management tools that support standard cleaning tasks. The choice of tool matters less than having a documented, systematic process.
Newsletter
Personalize your updates! Subscribe to ProjectBist's Newsletter and choose from the following categories.
Ethnographic Research: How to Study Culture and Community by Being Present in Ways Other Methods Cannot
Survey Translation and Back-Translation: How to Ensure Your Instrument Means the Same Thing in Every Language
How to Build a Research Firm From Scratch: What the First Three Years Actually Require