P
Loading blog...
Loading blog...
Too small and your findings are unreliable. Too large and you are wasting budget. Here is how to find the right number.
Priya Nair
Apr 06, 2026•4 min read
The two most common sample size mistakes researchers make are opposites of each other.
The first: a client hears that a study will survey 200 people and asks whether that is enough. The researcher says yes, and it turns out the margin of error is 7 percent, which makes the key findings statistically indistinguishable from chance.
The second: a funder allocates budget for 1,200 respondents when 384 would have given the same statistical confidence, and the extra 800 interviews produced nothing that changed the findings but consumed 60 percent of the project cost.
Sample size calculation exists to prevent both of these outcomes. Here is how to do it correctly.
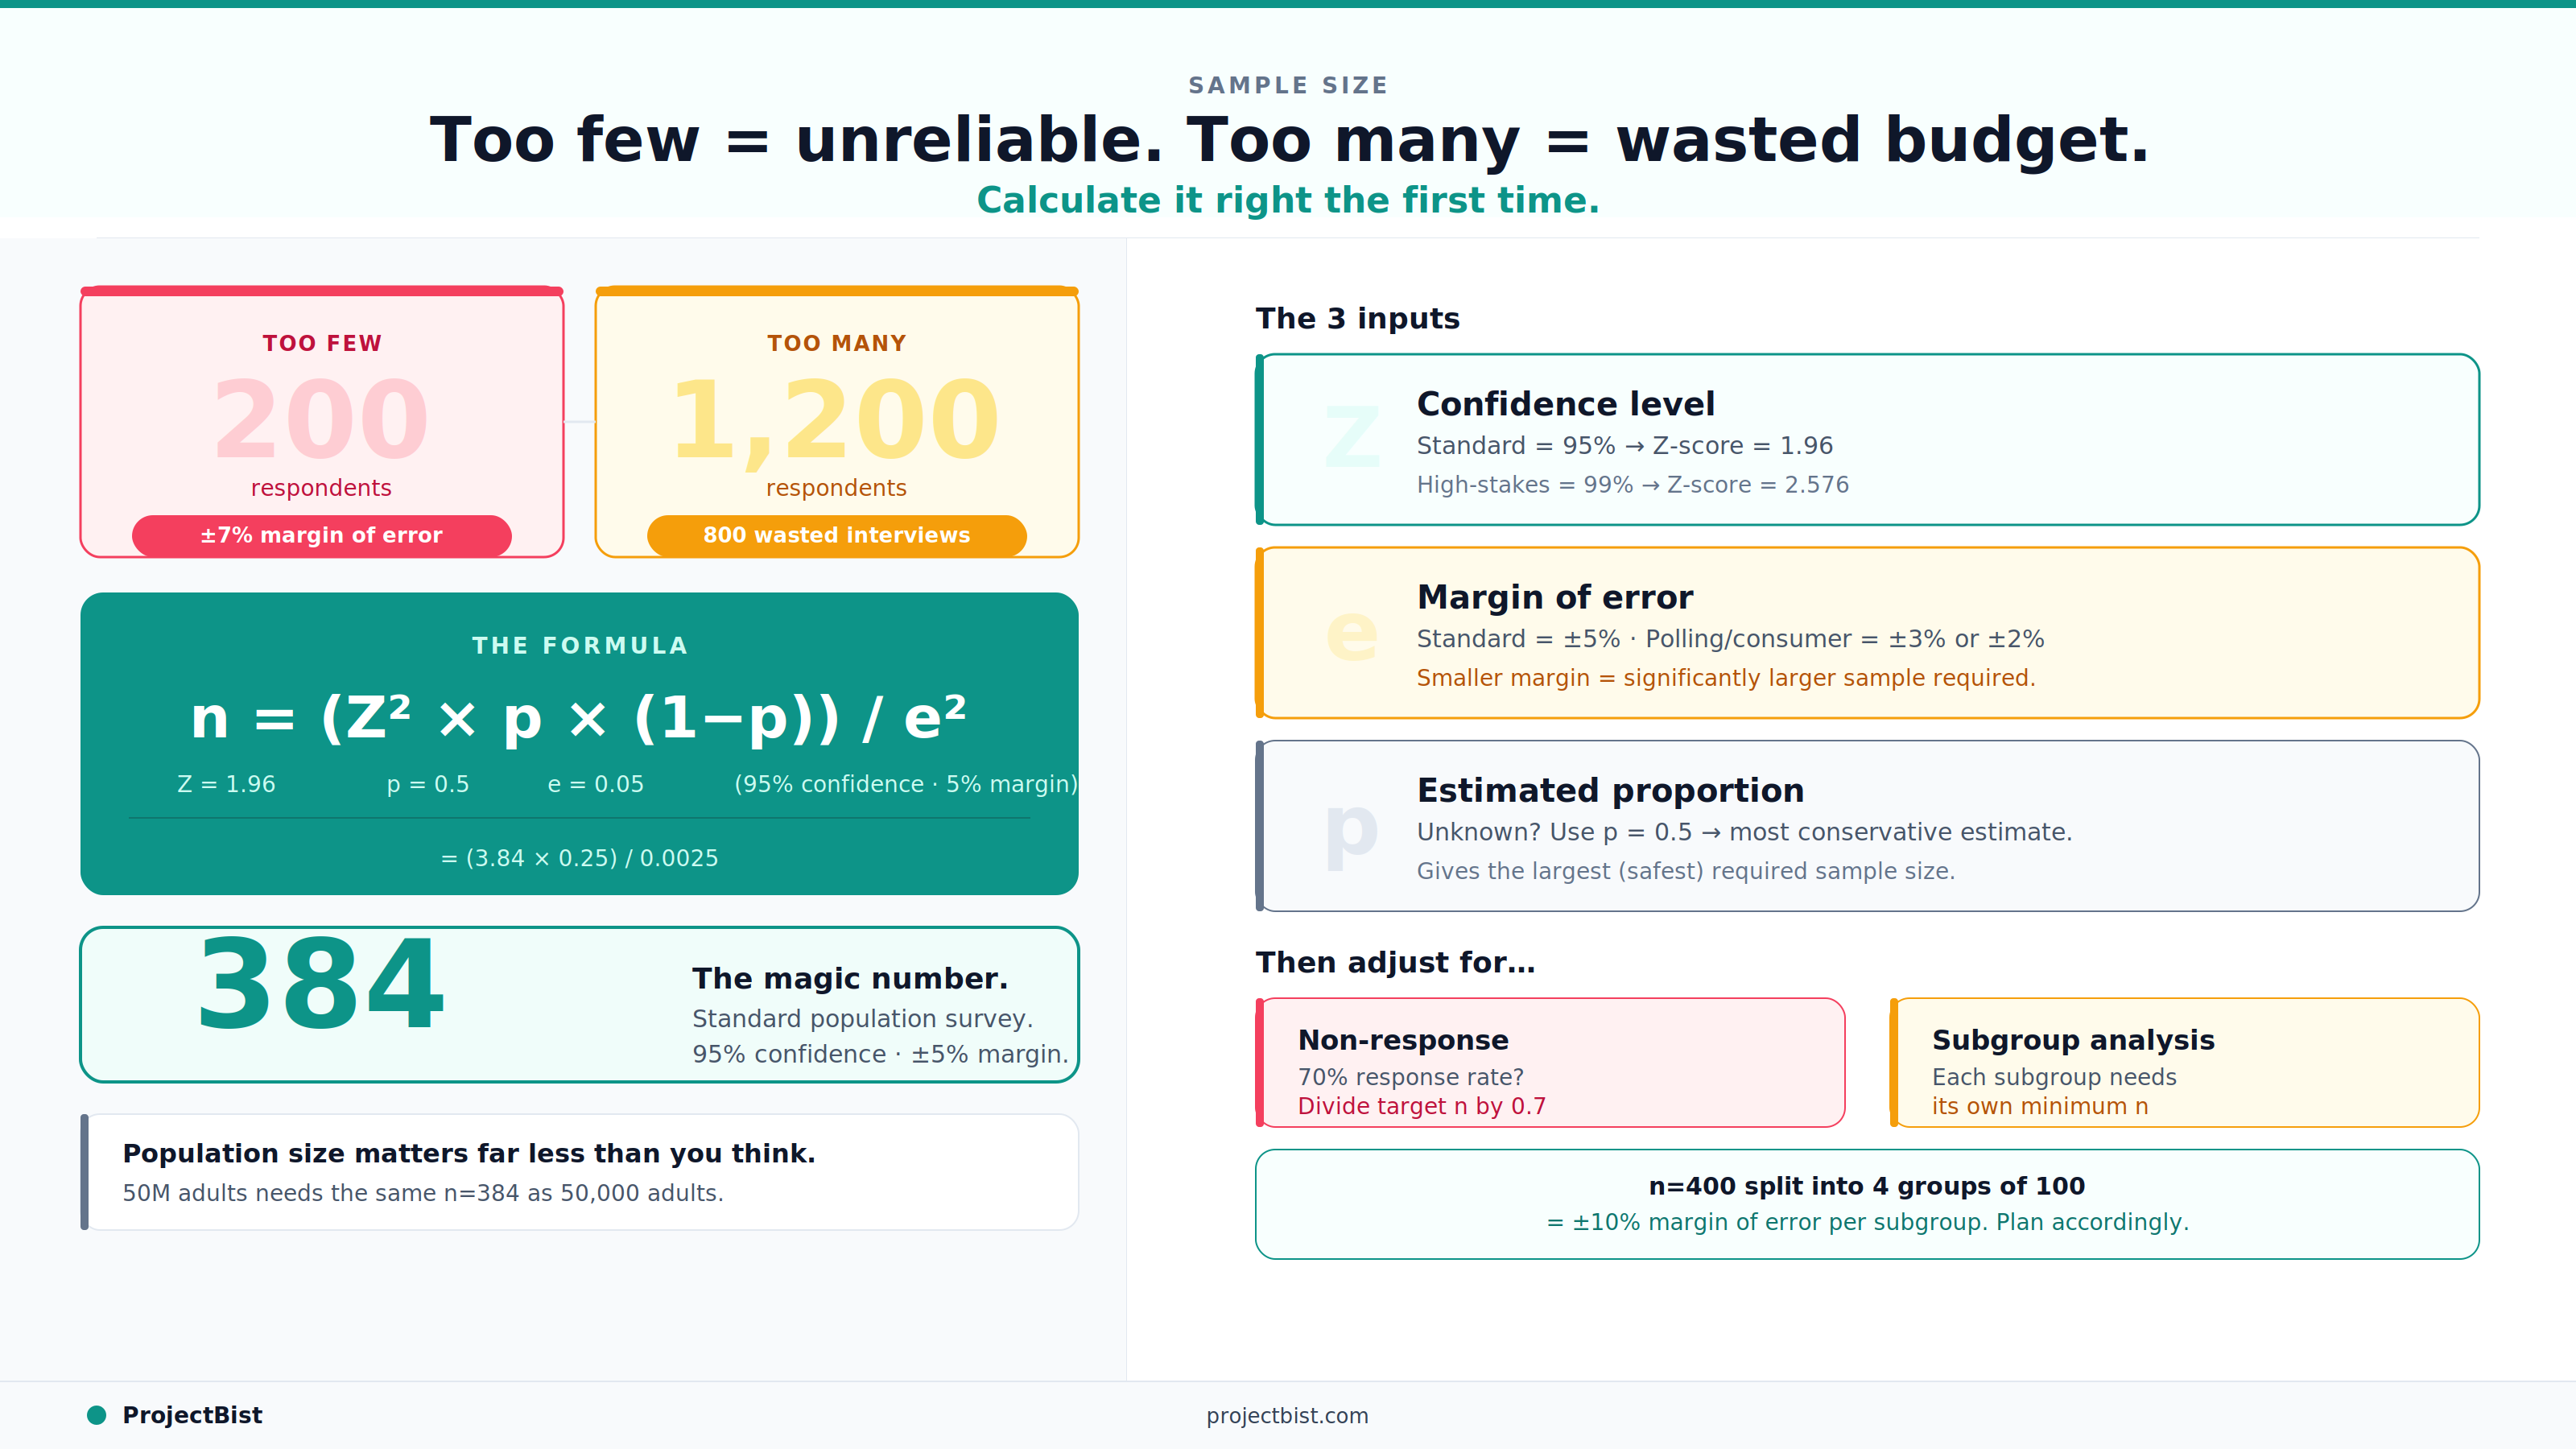
This is the probability that your findings accurately represent the true value in the population, if you repeated the study many times. The standard in social research is 95 percent confidence. What this means in practice: if you ran the same survey 100 times with different random samples, approximately 95 of those surveys would produce a result within the margin of error of the true population value.
95 percent confidence corresponds to a Z-score of 1.96 in the sample size formula. Some high-stakes research, such as clinical trials or government policy evaluations, uses 99 percent confidence (Z = 2.576).
Also called the confidence interval, this is the range within which the true population value is expected to fall. A 5 percent margin of error means that if 60 percent of your sample says yes to a question, the true population value is likely between 55 and 65 percent.
For most applied social research, a 5 percent margin of error is the standard. For media polling or consumer research where small differences are strategically significant, 3 percent or even 2 percent may be required, which significantly increases the required sample size.
For large populations (above approximately 10,000), population size has relatively little effect on the required sample size. The formula for an infinite population gives you the baseline sample size, and a finite population correction factor reduces it only modestly. The practical implication: a national survey of a country with 50 million adults does not require a proportionally larger sample than a survey of a city with 200,000 adults, assuming the same confidence and margin of error.
For a large or unknown population:
n = (Z² × p × (1-p)) / e²
where:
Plugging in standard values (95% confidence, 5% margin, p = 0.5):
n = (1.96² × 0.5 × 0.5) / 0.05² = (3.84 × 0.25) / 0.0025 = 384
This is where the widely used benchmark of 384 or 400 respondents comes from for a general population survey with standard parameters.
A sample of 400 properly drawn from a population of 10 million will give you the same statistical confidence as a sample of 400 drawn from a population of 50,000. Population size matters far less than most clients expect.
The formula above gives you the number of completed, usable responses you need. Before fieldwork, adjust upward for expected non-response. If your expected response rate is 70 percent, divide your target sample by 0.7 to get the number of contacts or screening interviews required.
Also adjust for subgroup analysis. If your study needs to produce statistically reliable estimates for subgroups such as gender, age cohort, or geographic region, each subgroup needs to be large enough on its own. A sample of 400 that splits into four equal groups of 100 has a margin of error of approximately 10 percent within each group, which may or may not be acceptable depending on the research question.
If budget constraints force a smaller sample than the calculation recommends, the right response is not to quietly proceed with an underpowered study. It is to document the statistical implications clearly: here is the sample we can afford, here is the margin of error it produces, and here is what that means for the conclusions we can and cannot draw from the findings.
That transparency protects both the researcher and the client from making decisions based on findings that carry more uncertainty than the report suggests.
ProjectBist connects you with verified research professionals across all methodologies.
Find Survey Specialistsarrow_forwardNewsletter
Personalize your updates! Subscribe to ProjectBist's Newsletter and choose from the following categories.
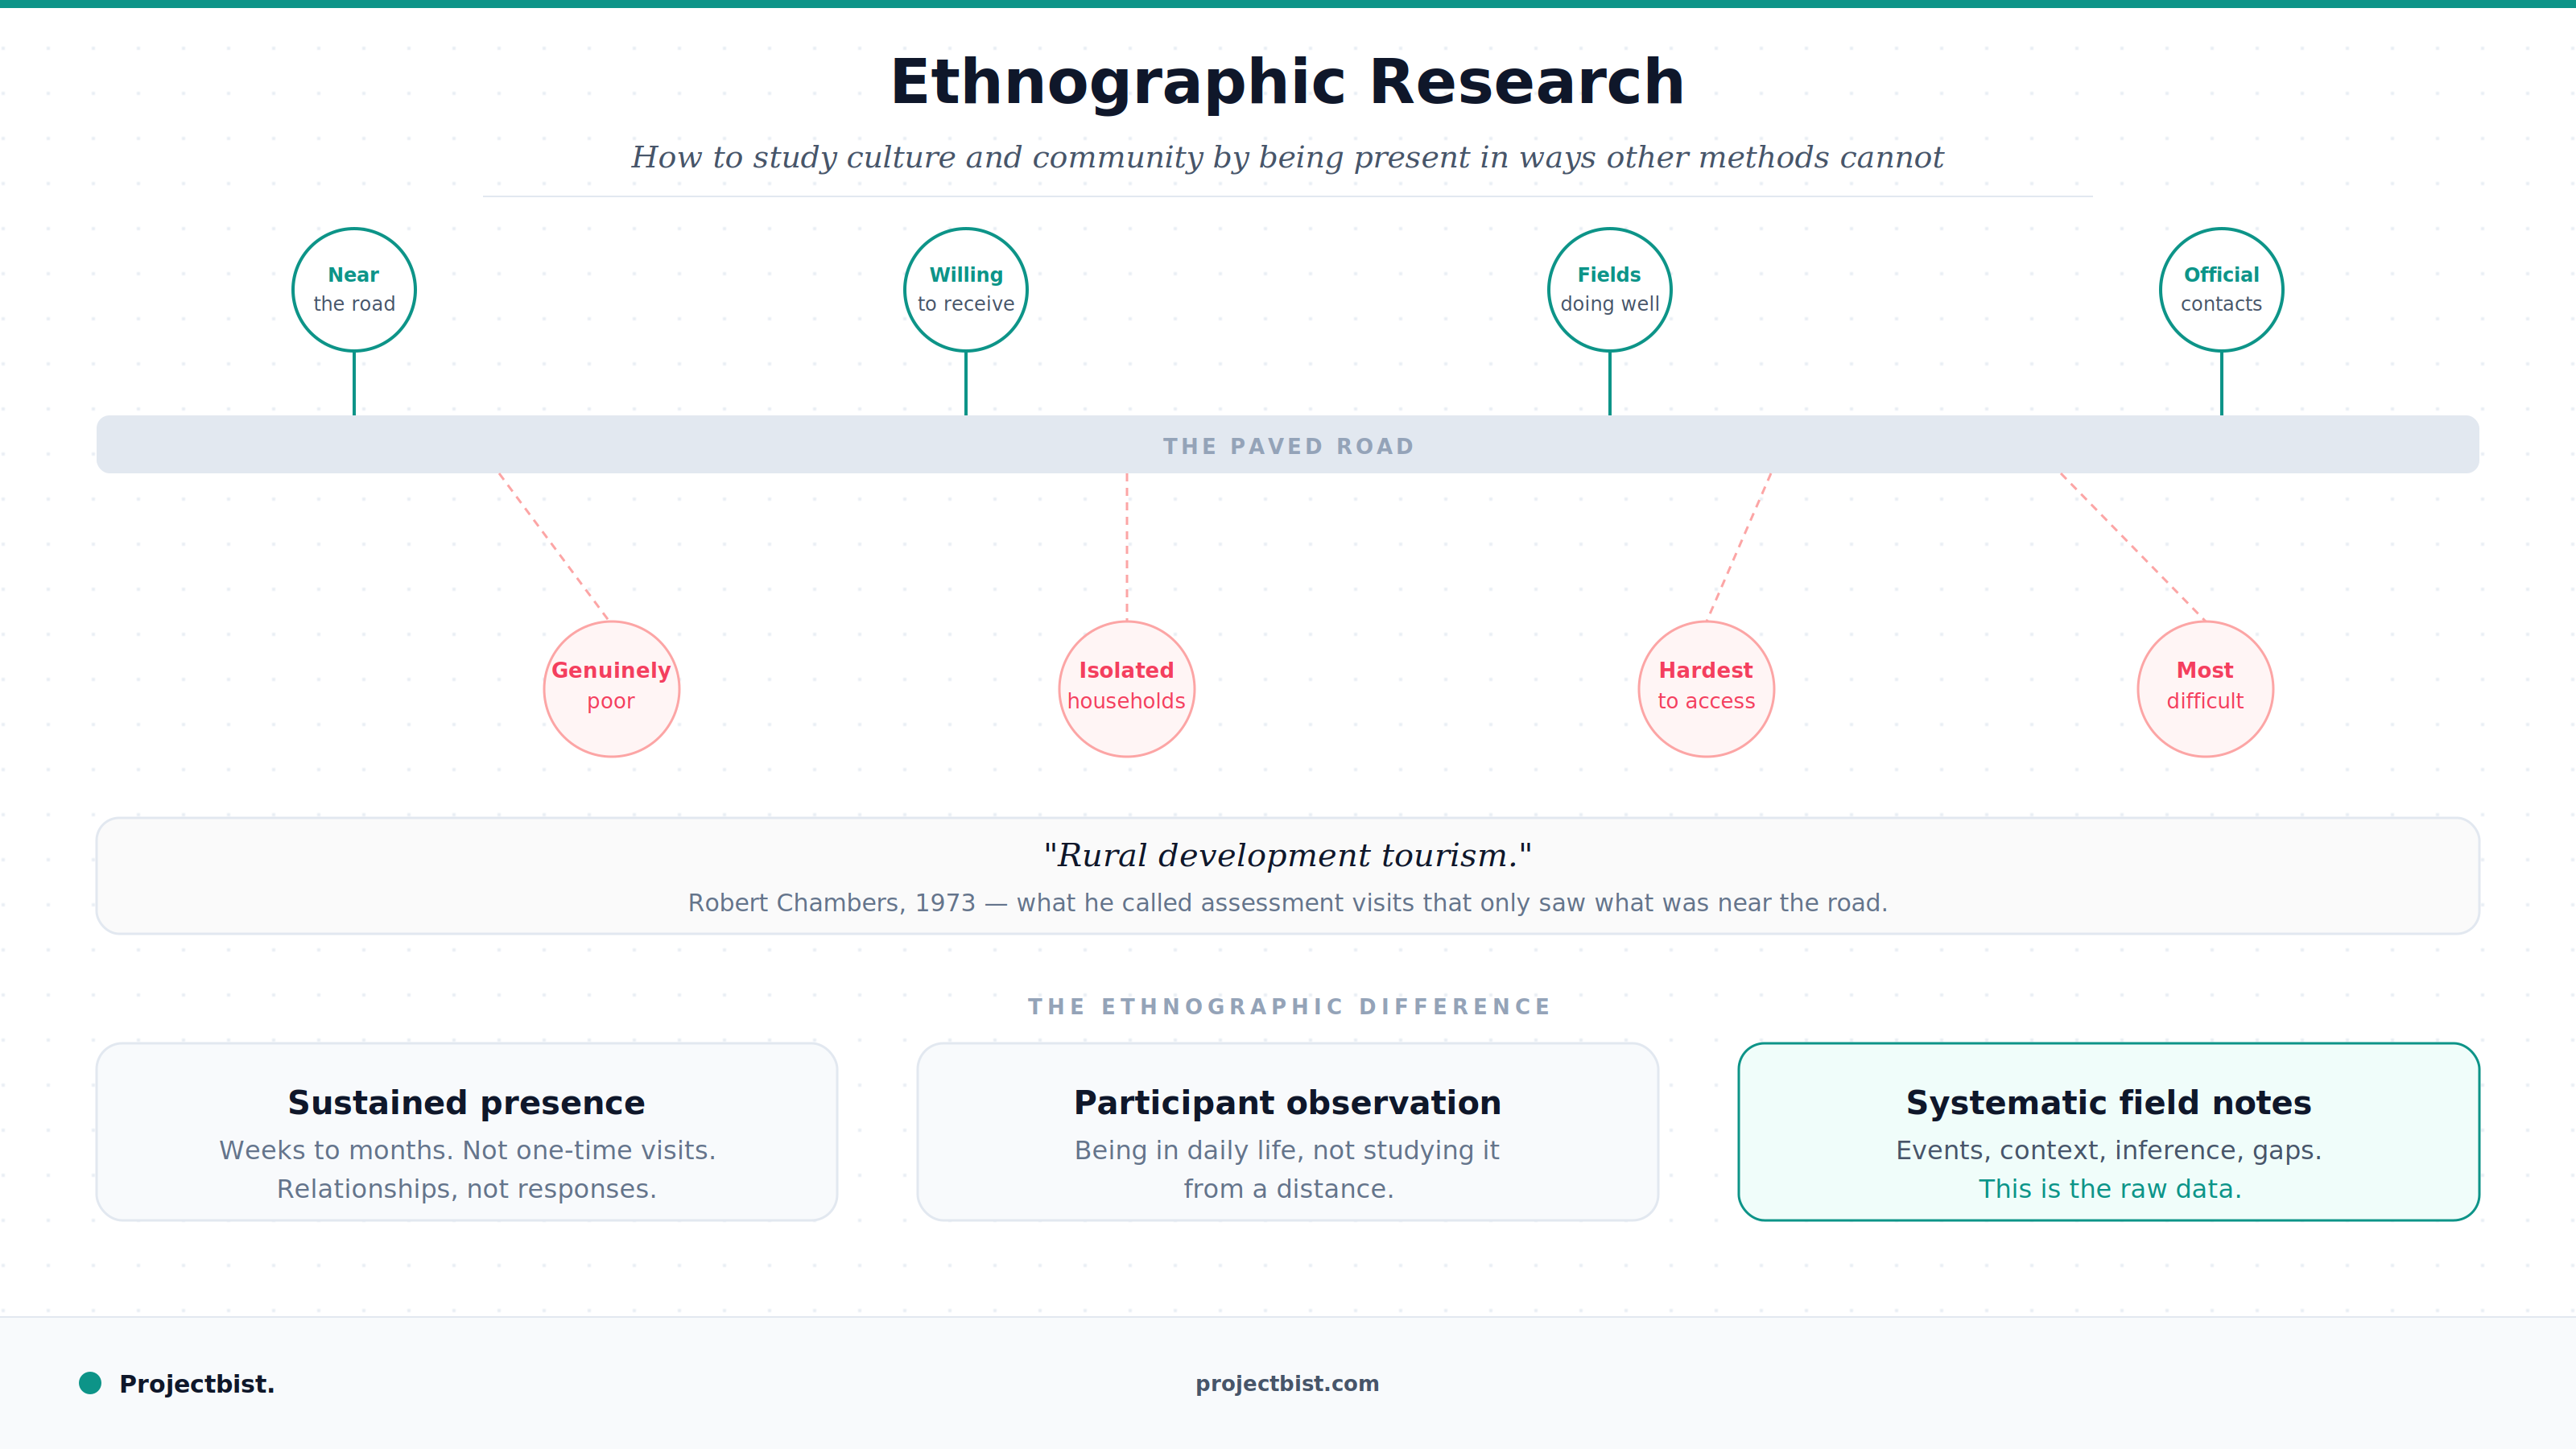
Ethnographic Research: How to Study Culture and Community by Being Present in Ways Other Methods Cannot
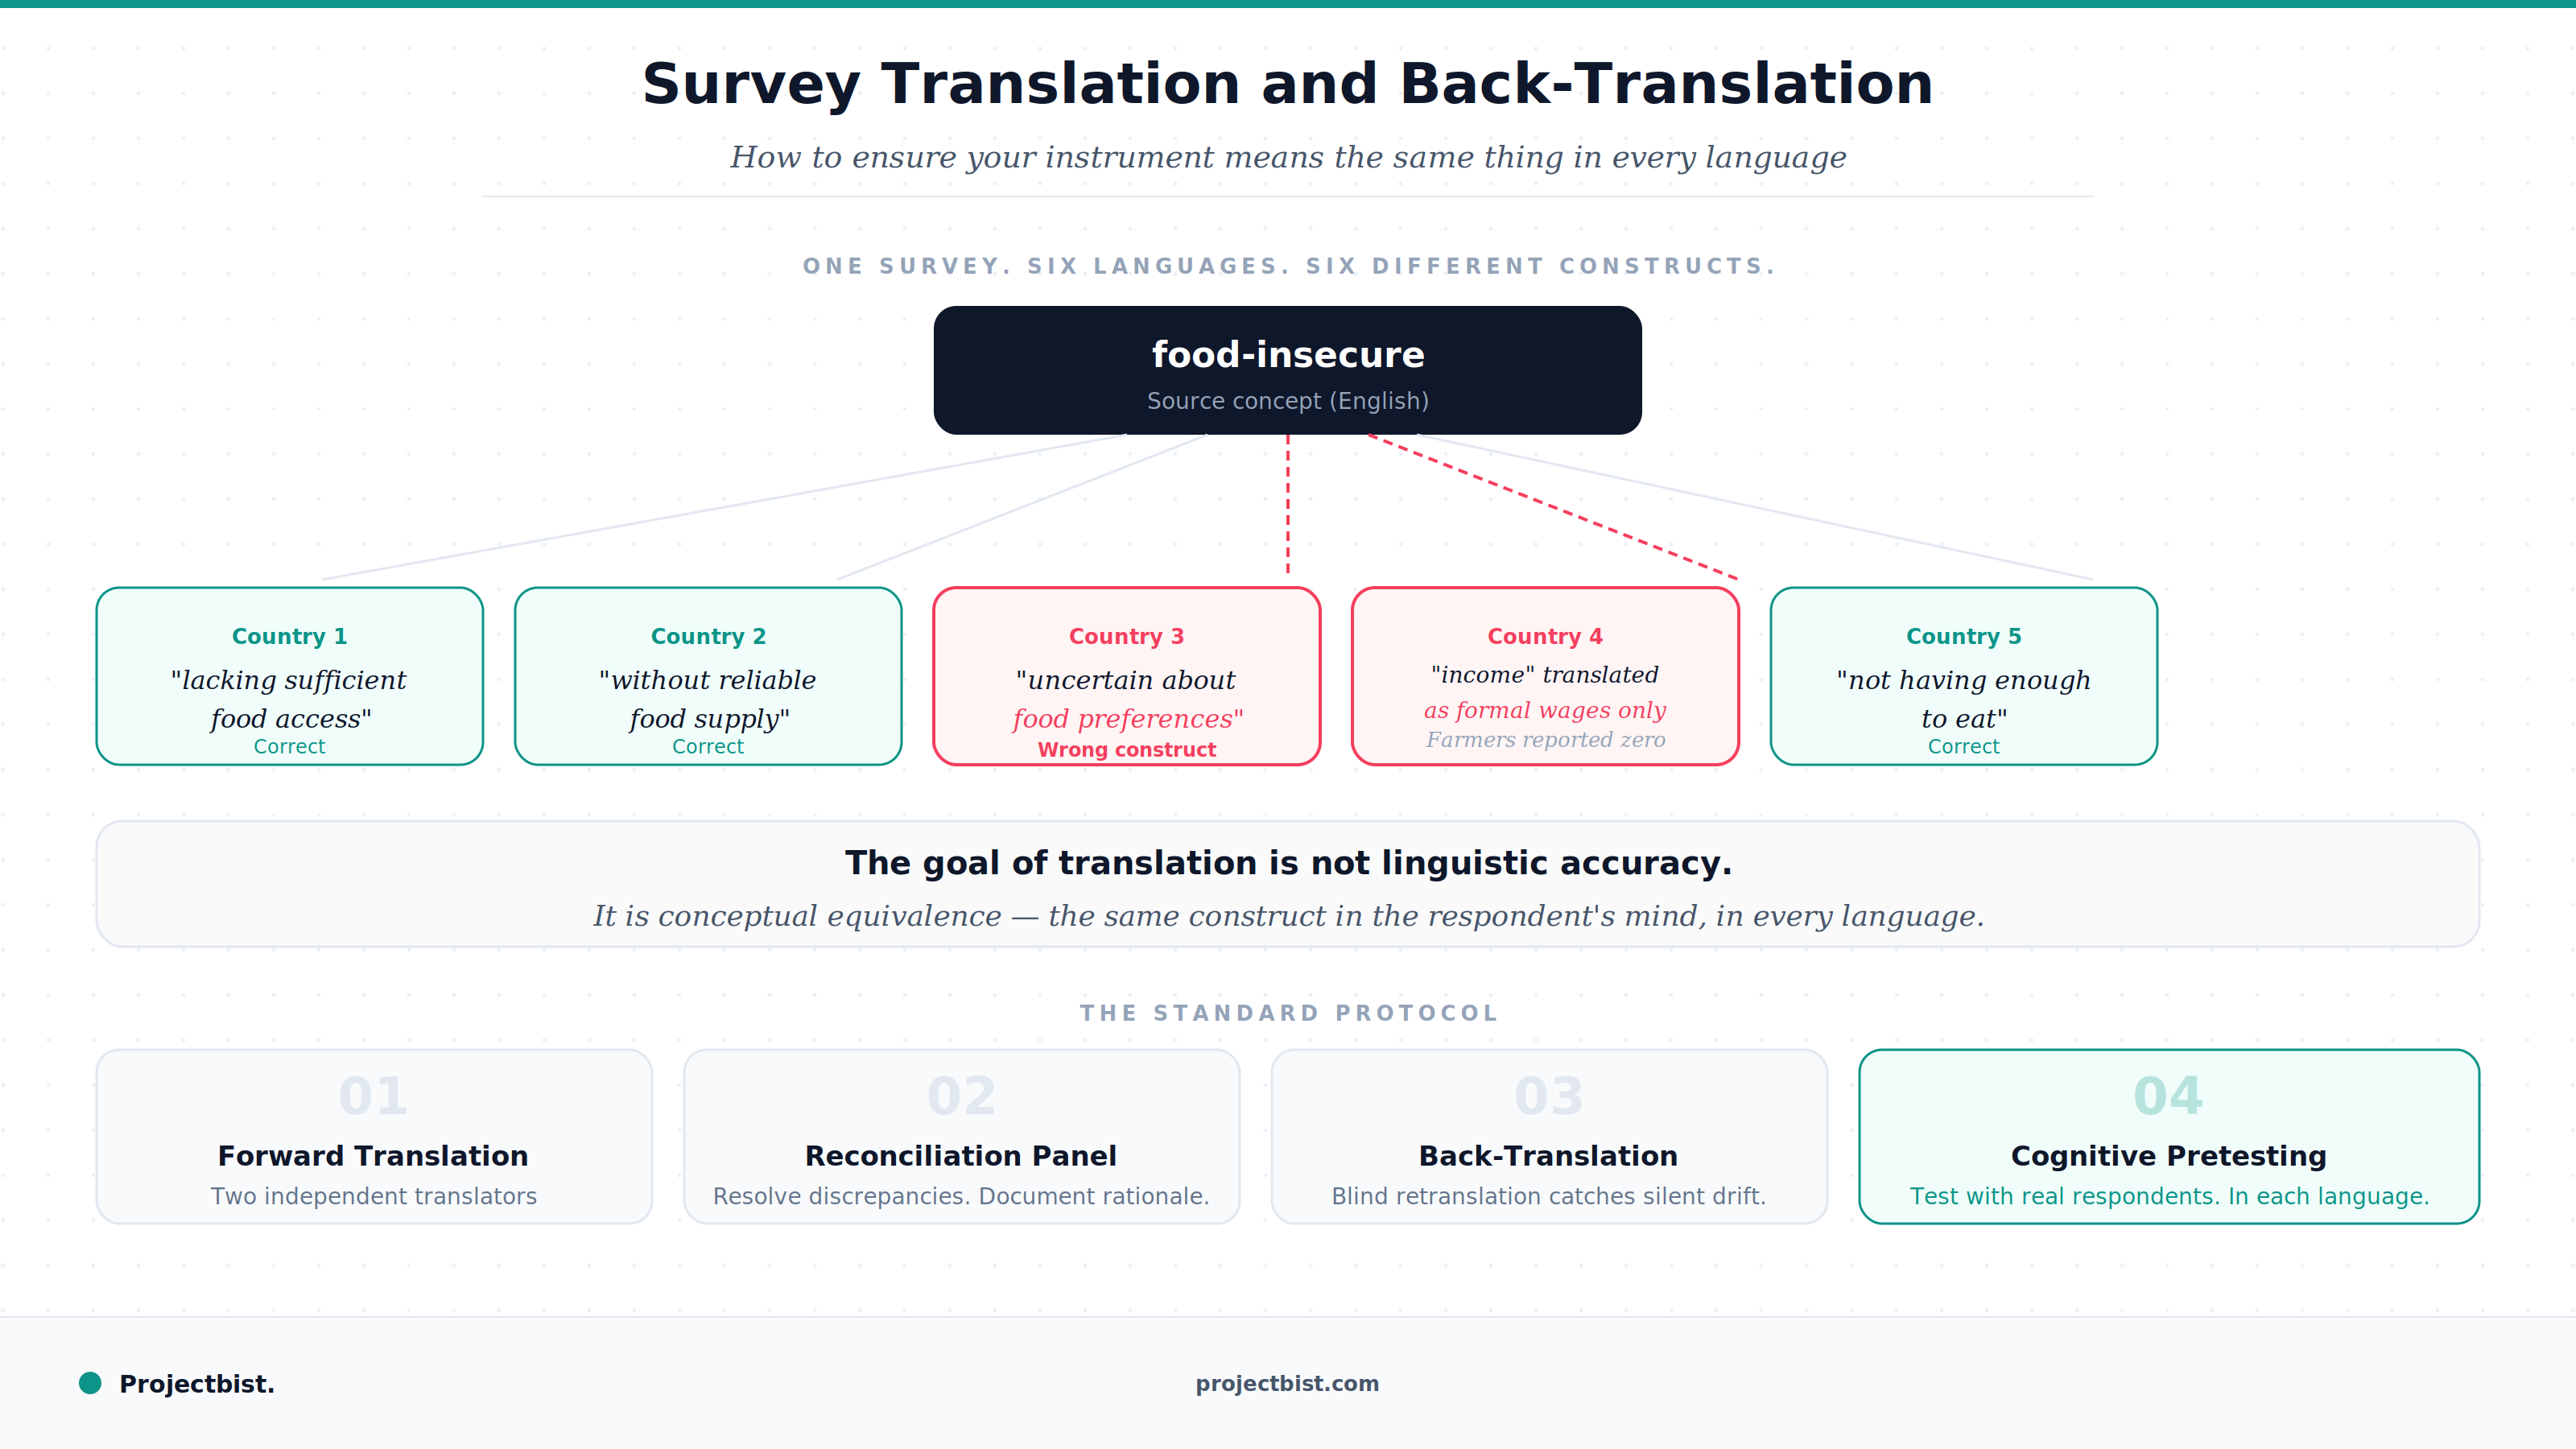
Survey Translation and Back-Translation: How to Ensure Your Instrument Means the Same Thing in Every Language
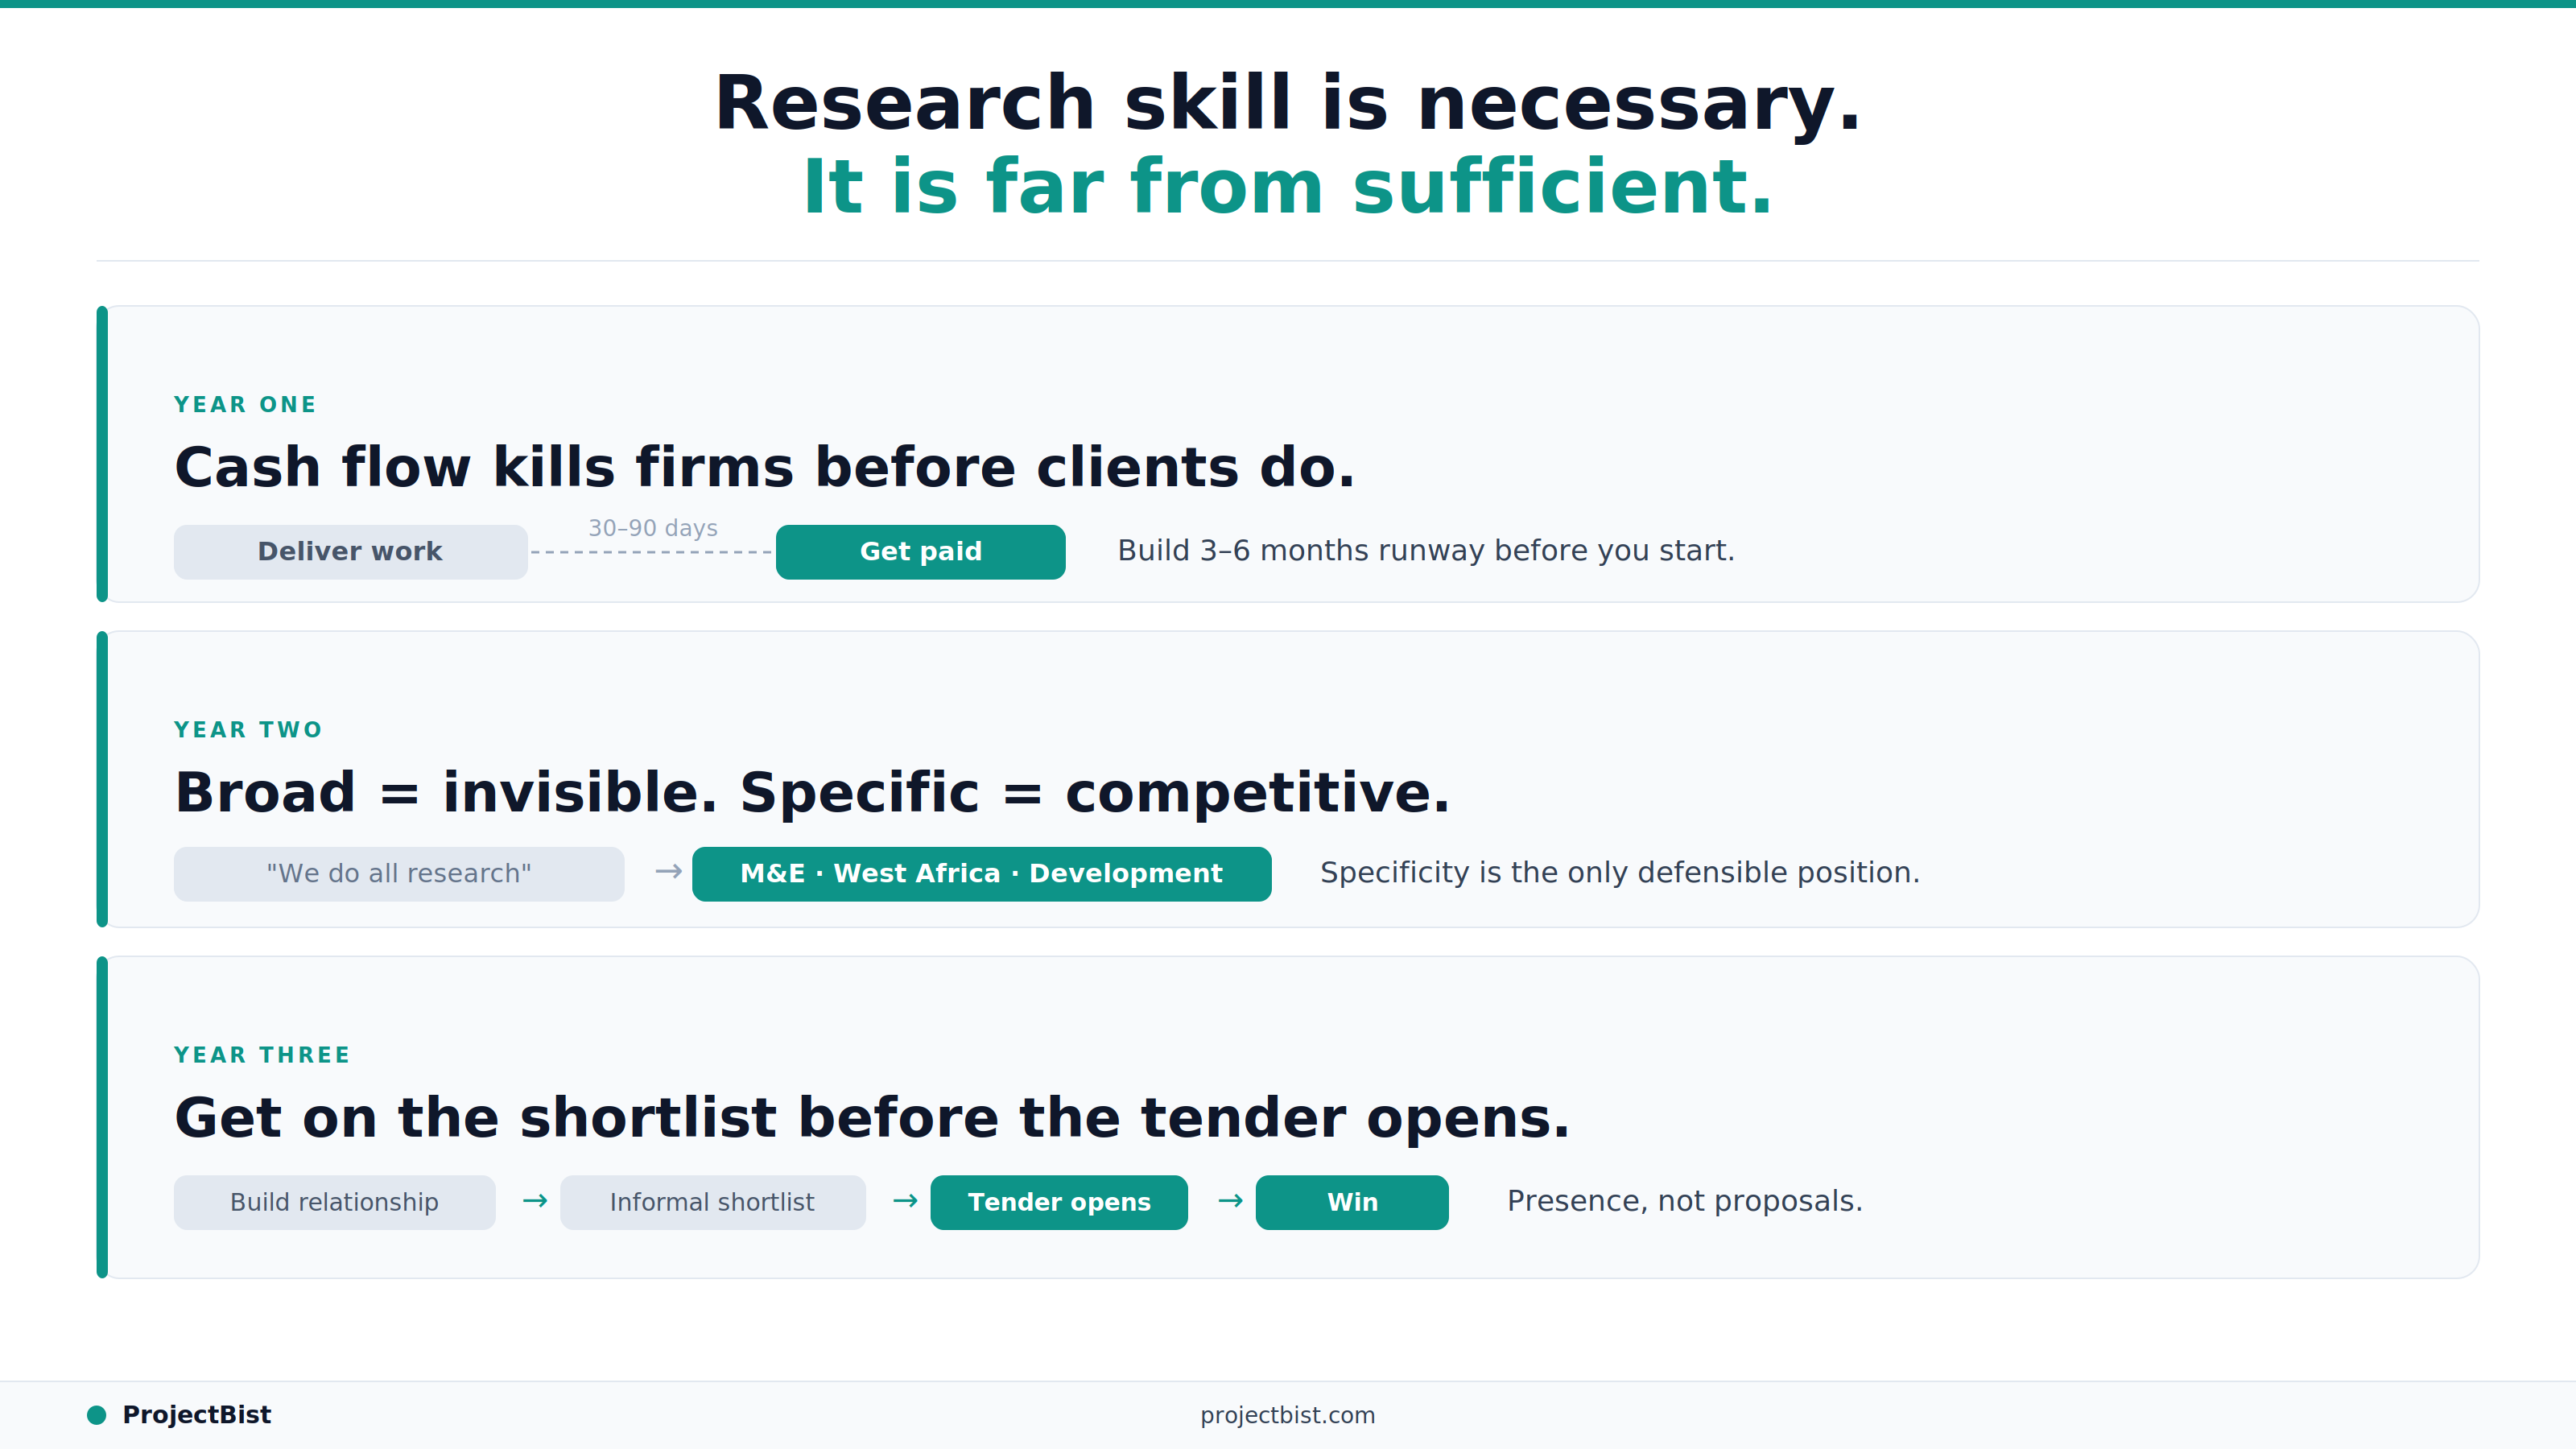
How to Build a Research Firm From Scratch: What the First Three Years Actually Require