P
Loading blog...
Loading blog...
Asking people what they want gives you one kind of answer. Watching them choose gives you another. Conjoint analysis gives you the second.
Ravi Menon
Apr 04, 2026•5 min read
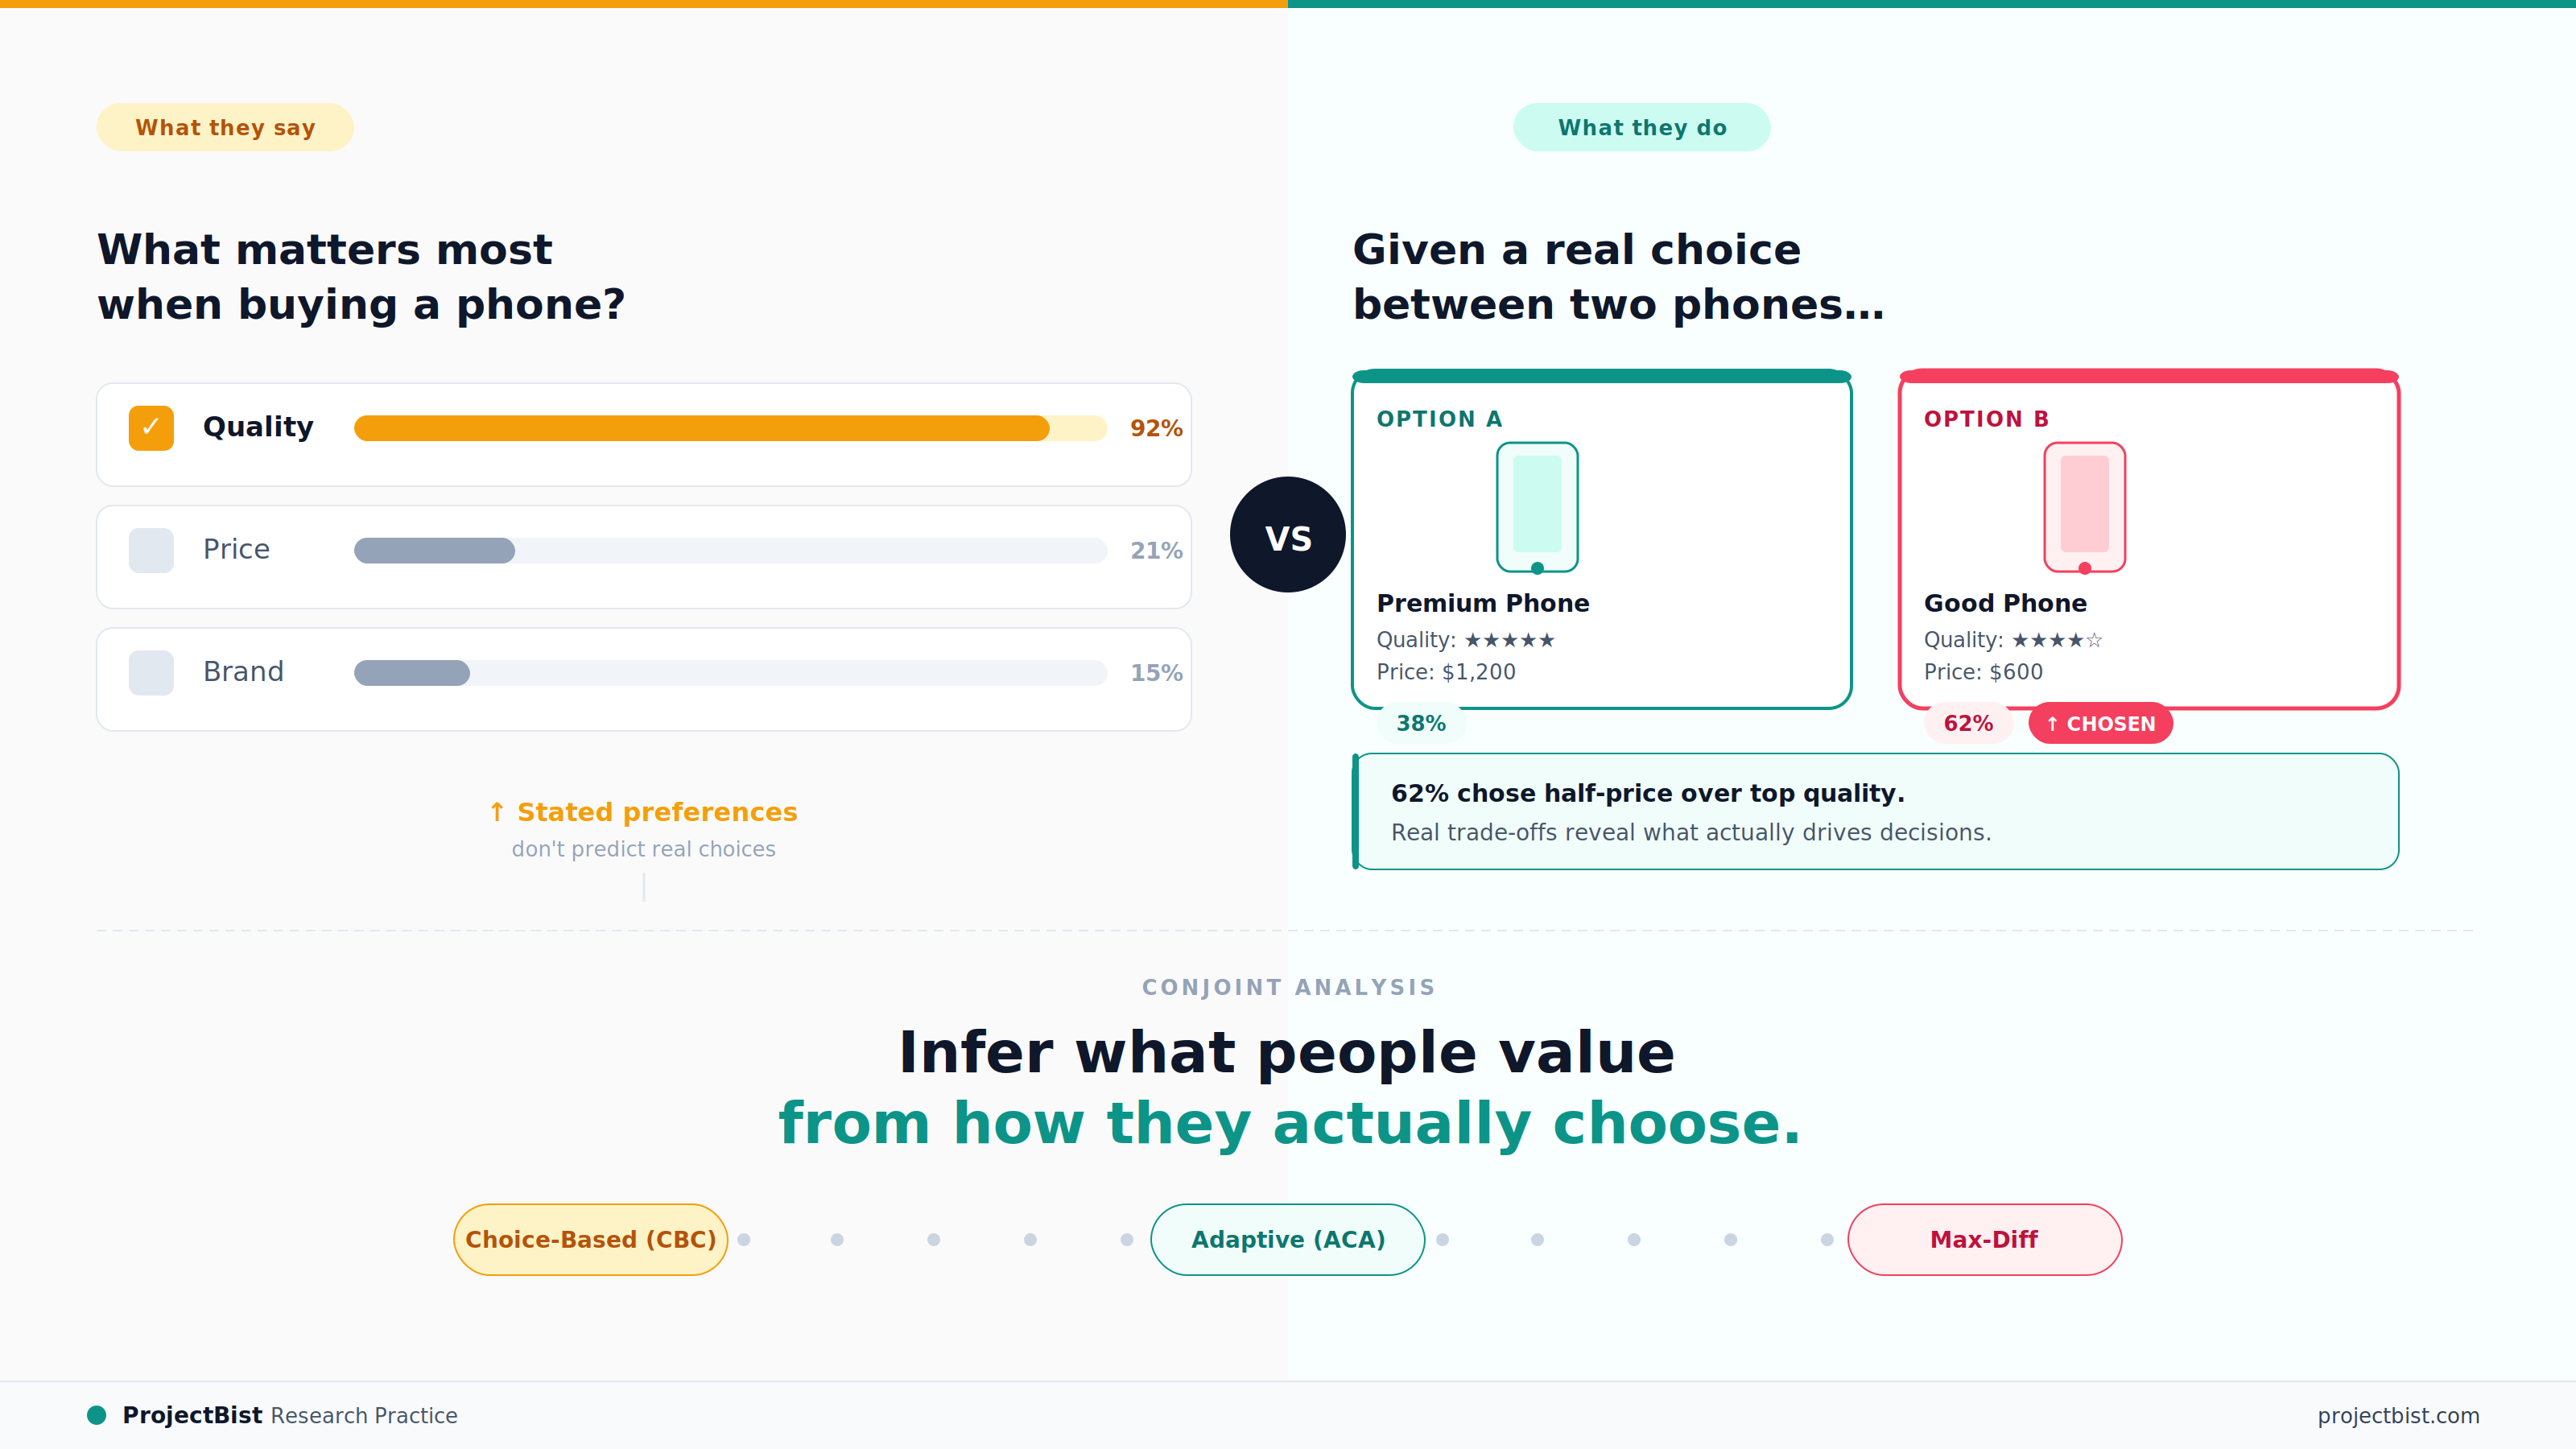
Ask a hundred consumers whether price or product quality matters more to them when buying a smartphone. Almost all of them will say quality.
Put the same hundred consumers in a real purchase scenario where they have to choose between a high-quality phone at a premium price and a slightly lower-quality phone at half the price, and you will see a very different distribution of choices.
The gap between what people say they value and how they actually behave when forced to make real trade-offs is one of the oldest problems in market research. Conjoint analysis is the tool designed specifically to close that gap.
Conjoint analysis is a quantitative research method that measures consumer preferences by presenting respondents with sets of realistic product options and asking them to choose rather than asking them to rate or rank features in isolation. It was first developed in the 1970s as a mathematical approach to understanding multi-attribute decision-making and has since become one of the most widely used methods in market research, product development, and pricing strategy.
According to Conjointly, conjoint analysis is used by businesses of all sizes, across industries including consumer goods, technology, financial services, healthcare, and real estate, to answer questions that direct questioning cannot reliably answer.
Every product or service can be described in terms of its attributes and the levels those attributes can take.
For a laptop: the attributes might be brand, battery life, storage size, and price. Each attribute has multiple levels: battery life could be 8 hours, 12 hours, or 16 hours. A conjoint study takes combinations of these attribute levels and presents them to respondents as realistic product options to choose between.
The magic is in what happens when you analyze those choices. Because respondents are forced to make trade-offs, the analysis can calculate how much each attribute level contributes to their preferences, which attributes matter most, and how much price premium a specific feature can command.
Conjoint analysis does not ask what people want. It infers what they want from how they choose when they cannot have everything.
The most widely used form. Respondents see sets of product options and choose their preferred one from each set. This closely mimics real purchase decisions. CBC produces individual-level preference estimates and can be used to simulate market share for any combination of product attributes.
The survey adapts in real time based on the respondent's previous answers, showing them options that are most relevant to their expressed preferences. Particularly useful for products with many attributes, where a fixed design would produce too many choice sets for respondents to complete reliably.
Respondents choose the most and least preferred option from each set. This produces very fine-grained discrimination between attributes and is particularly effective for understanding the relative importance of a long list of features. Technically not a traditional conjoint method but often used for similar purposes.
Conjoint analysis measures stated preferences in a simulated choice environment. It assumes respondents respond to the product profiles as described, without accounting for factors like brand trust built over years, in-store experience, or social influence from peers. In categories where these factors are dominant, conjoint findings should be treated as directional rather than predictive.
It also cannot tell you why consumers prefer certain attributes. For that, you pair conjoint with qualitative research: focus groups or in-depth interviews that explore the motivations behind the preferences the conjoint analysis measured.
What sample size does a conjoint study typically require?
A minimum of 200 completed responses is the general baseline for producing statistically reliable preference estimates in a choice-based conjoint study. If you need to analyze subgroups separately, each subgroup needs enough respondents to produce stable estimates independently, which often means a total sample of 400 or more. The exact number depends on the number of attributes, the number of levels, and the study design. A researcher specializing in conjoint analysis will recommend the right sample size once the study design is finalized.
How long does a conjoint survey typically take a respondent to complete?
A well-designed choice-based conjoint survey typically takes 15 to 20 minutes, including an introduction and any qualifying questions. Surveys with more than 15 choice tasks or highly complex product profiles tend to produce lower data quality because respondents begin simplifying their decision rules to manage fatigue. If your product has many attributes, an adaptive design that adjusts the choice sets based on earlier responses can reduce survey length without sacrificing analytical depth.
Is conjoint analysis suitable for services, or does it only work for physical products?
Conjoint analysis works well for services. It is widely used in financial services, insurance, healthcare, hospitality, and telecommunications research to understand which service features drive choice and how customers trade off between service quality, price, and convenience. The attributes and levels are simply defined in terms of service characteristics rather than physical product features. What matters is that the attributes can be clearly described and that respondents can meaningfully distinguish between the levels.
How is conjoint analysis different from a straightforward feature ranking survey?
A feature ranking survey asks respondents to directly state which features matter most to them. People consistently overstate the importance of price, quality, and safety in direct ranking tasks because these are the socially acceptable answers. Conjoint analysis does not ask what matters. It infers importance from how respondents actually choose when they have to make trade-offs between realistic product options. The difference in results can be significant, particularly for price sensitivity, which is almost always understated in direct questioning.
Conjoint is the right tool when you need to make a product, pricing, or feature decision and direct questioning is likely to produce socially desirable or strategically biased answers. It is commonly used for new product development, pricing research, pack design optimization, and competitive positioning.
It requires a meaningful sample size, typically 200 or more respondents, to produce statistically reliable preference estimates. And it requires careful design: the choice sets must be constructed using an appropriate experimental design to ensure the attributes are properly balanced and estimable.
ProjectBist profiles show methodology specializations. Filter for quantitative researchers.
Search Quantitative Researchersarrow_forwardSources: Conjointly — What is Conjoint Analysis; Harvard Business School Online — Conjoint Analysis; Sawtooth Software; GeoPoll — Conjoint Analysis in Market Research; Wikipedia — Conjoint Analysis; Drive Research 2025
Newsletter
Personalize your updates! Subscribe to ProjectBist's Newsletter and choose from the following categories.
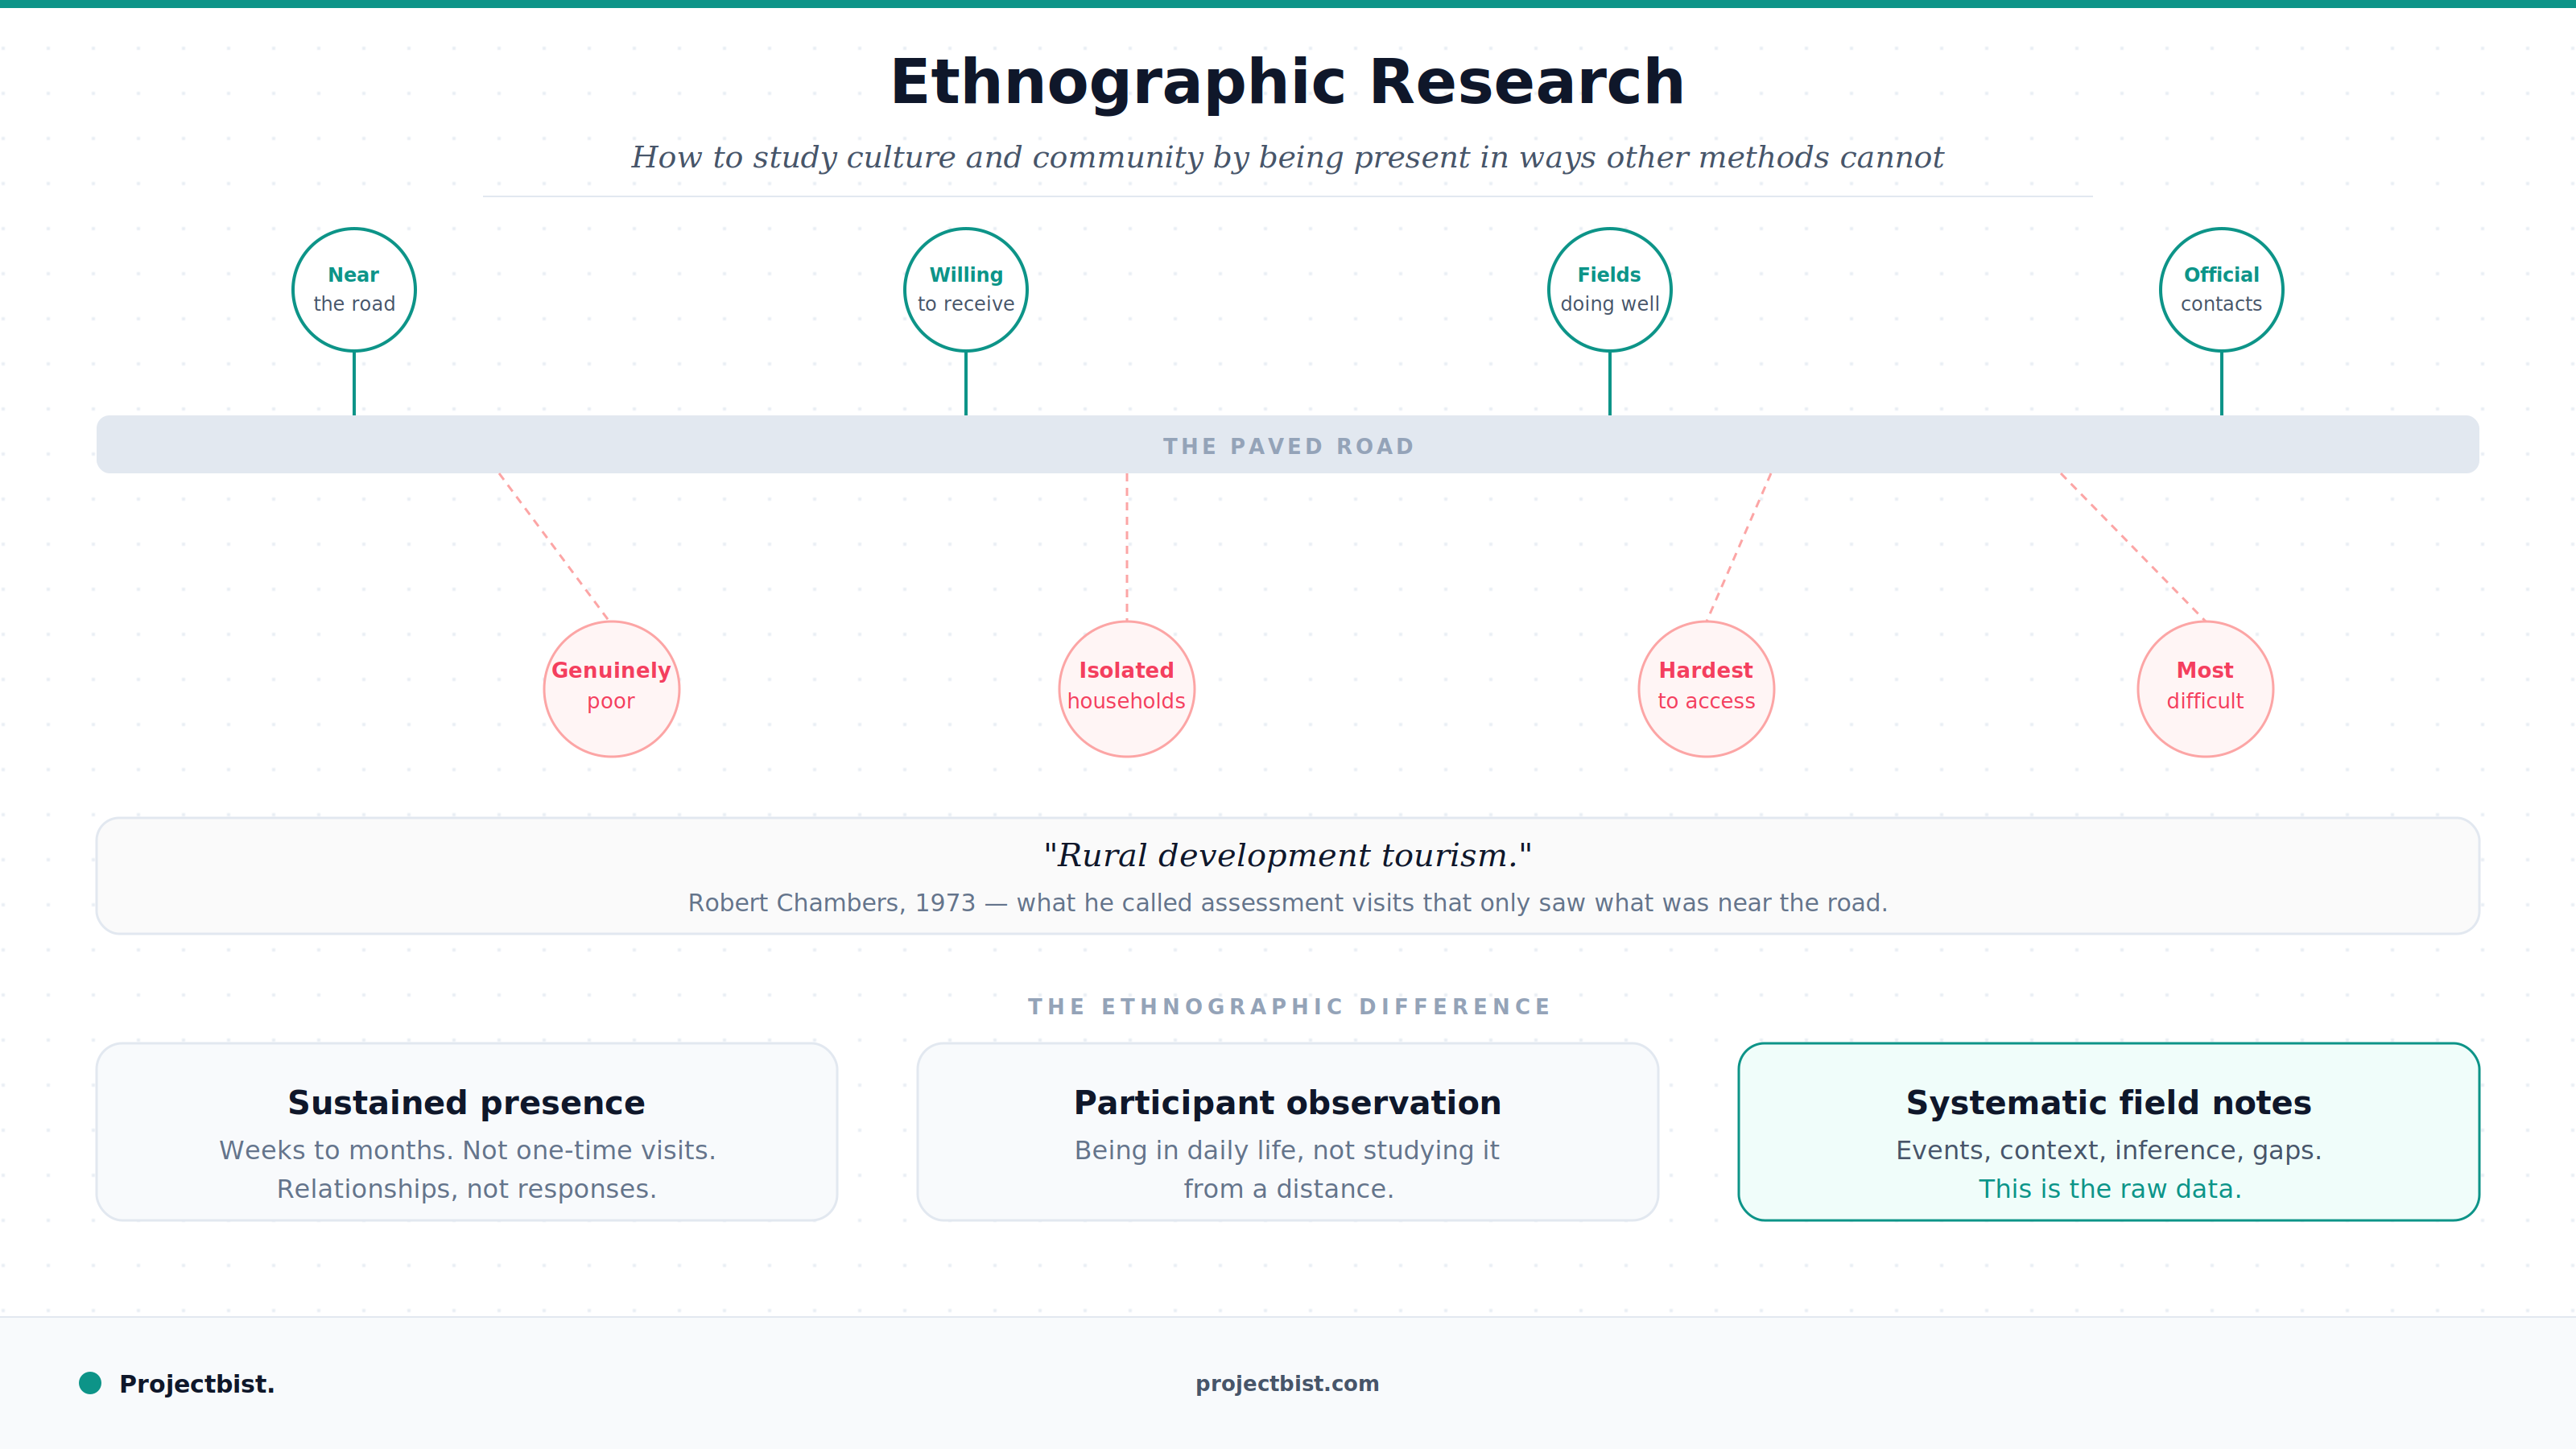
Ethnographic Research: How to Study Culture and Community by Being Present in Ways Other Methods Cannot
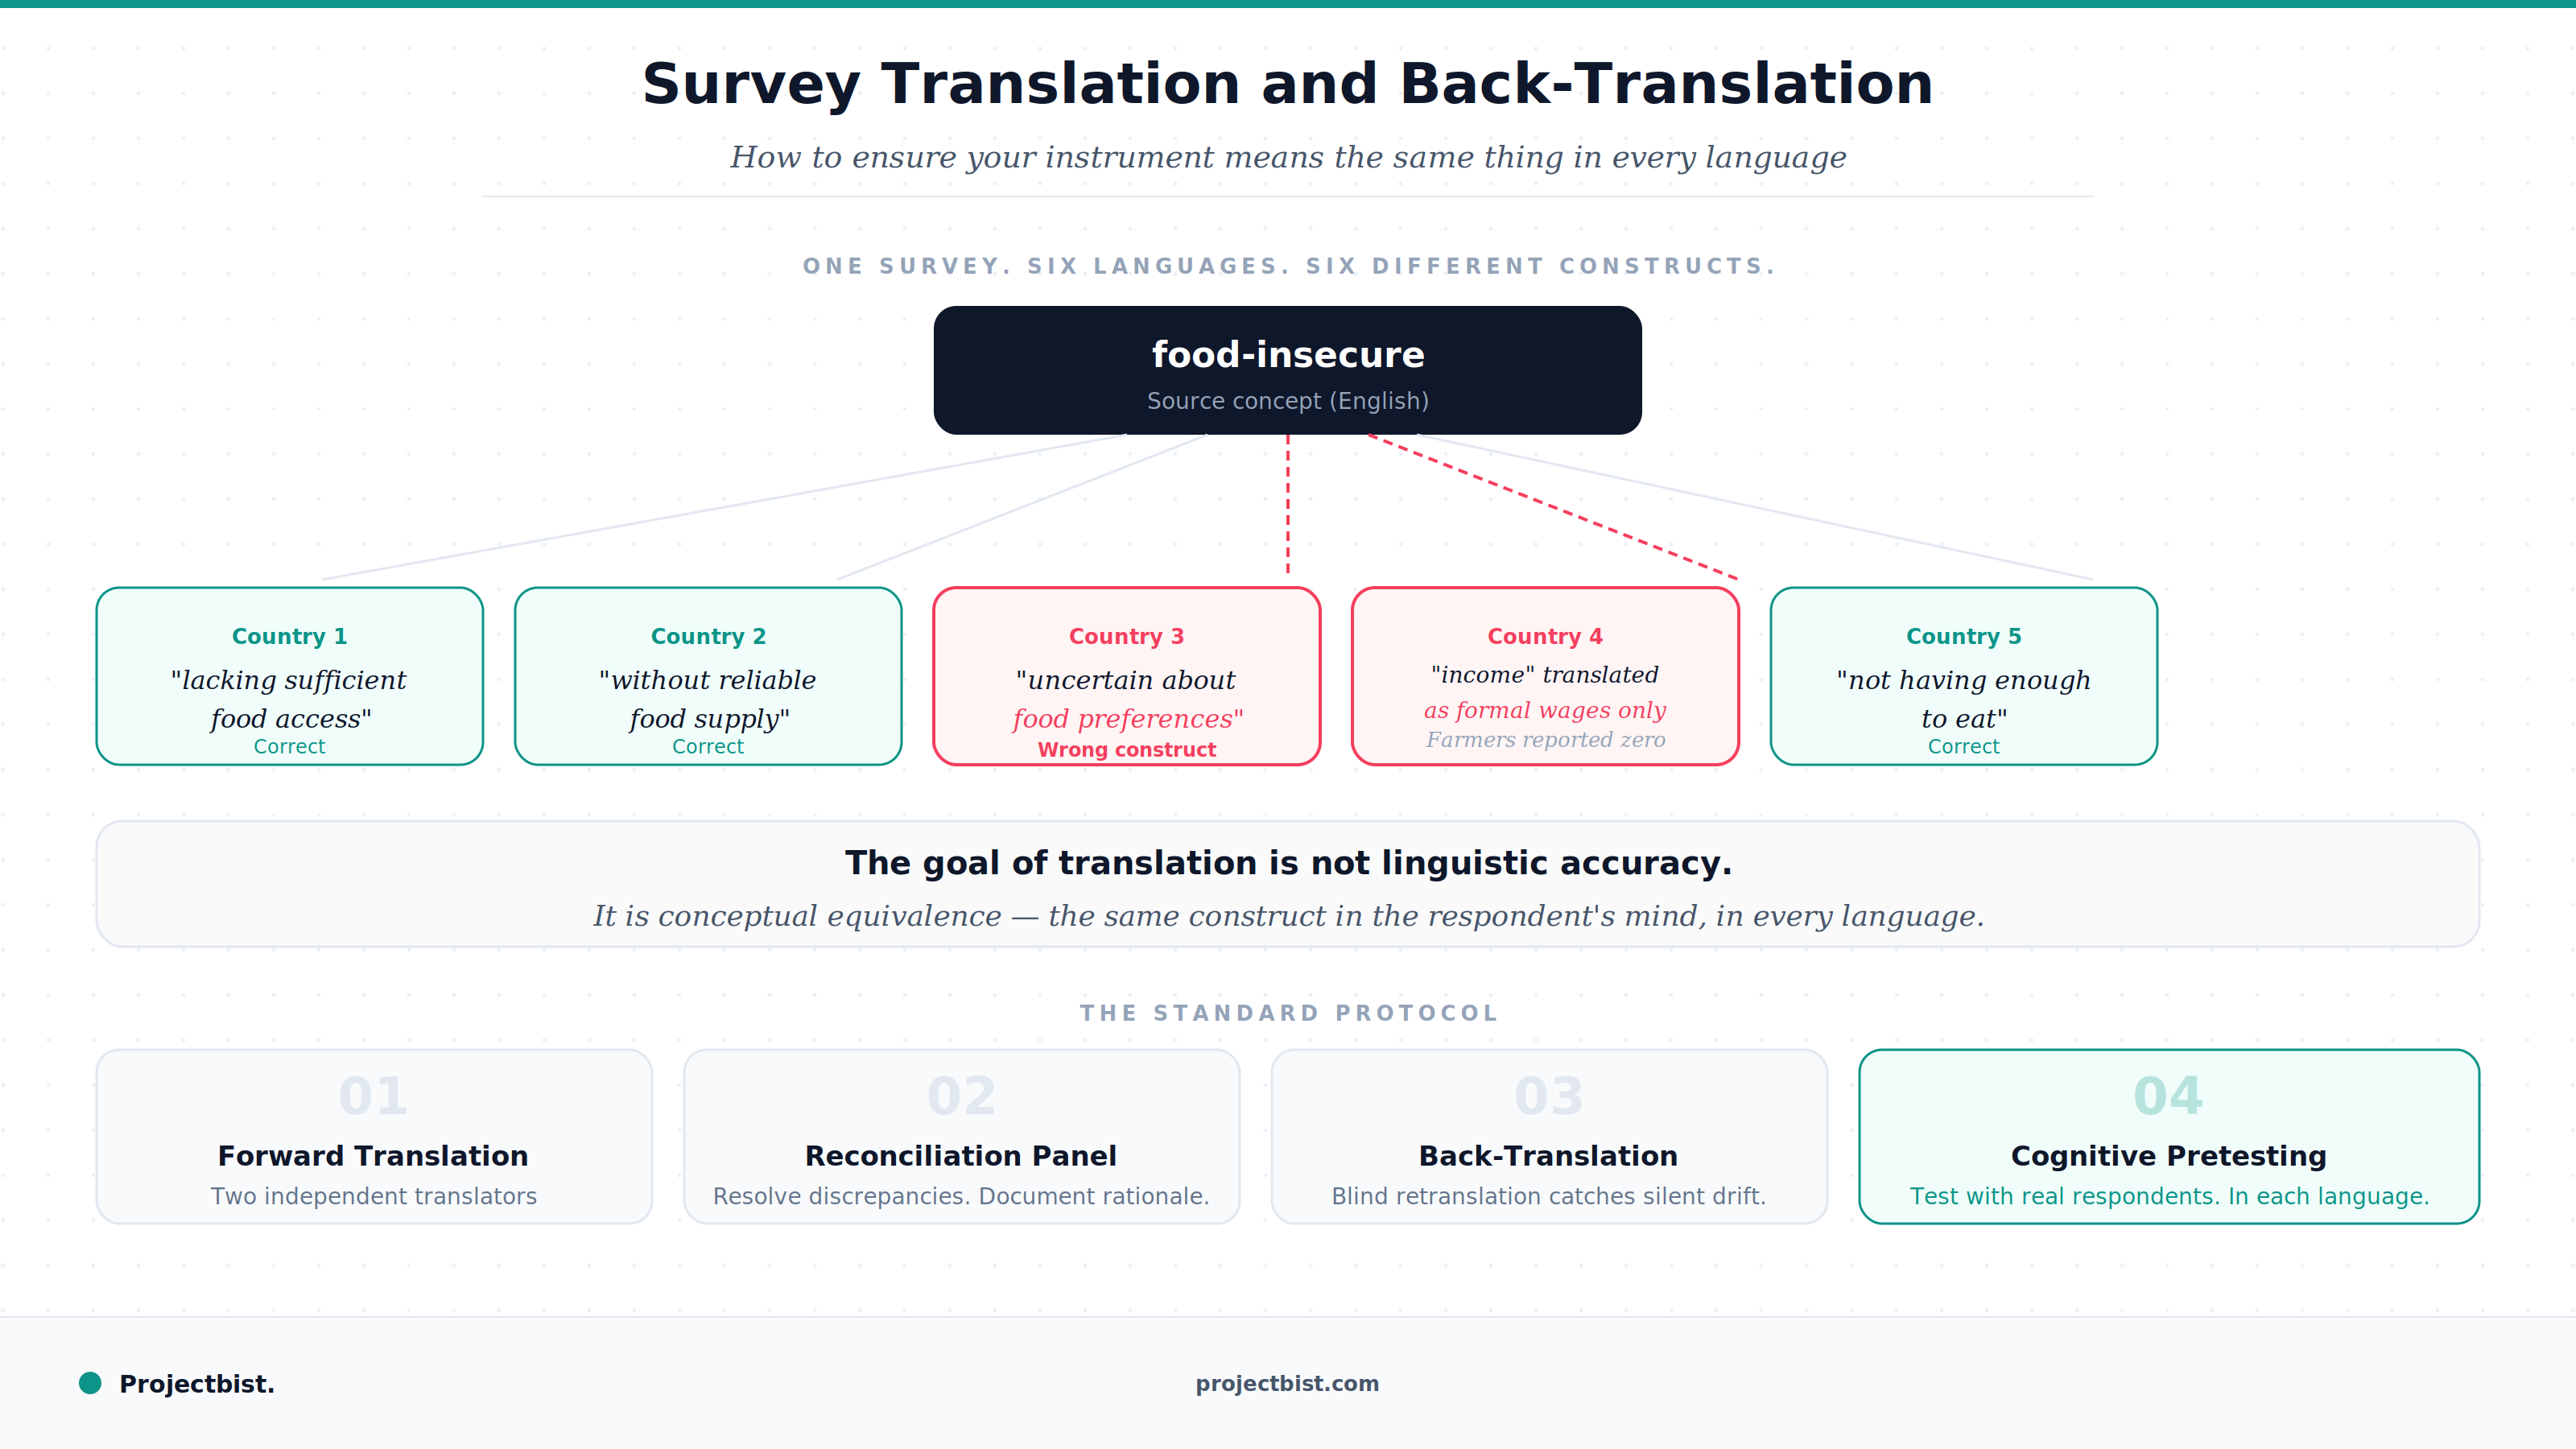
Survey Translation and Back-Translation: How to Ensure Your Instrument Means the Same Thing in Every Language
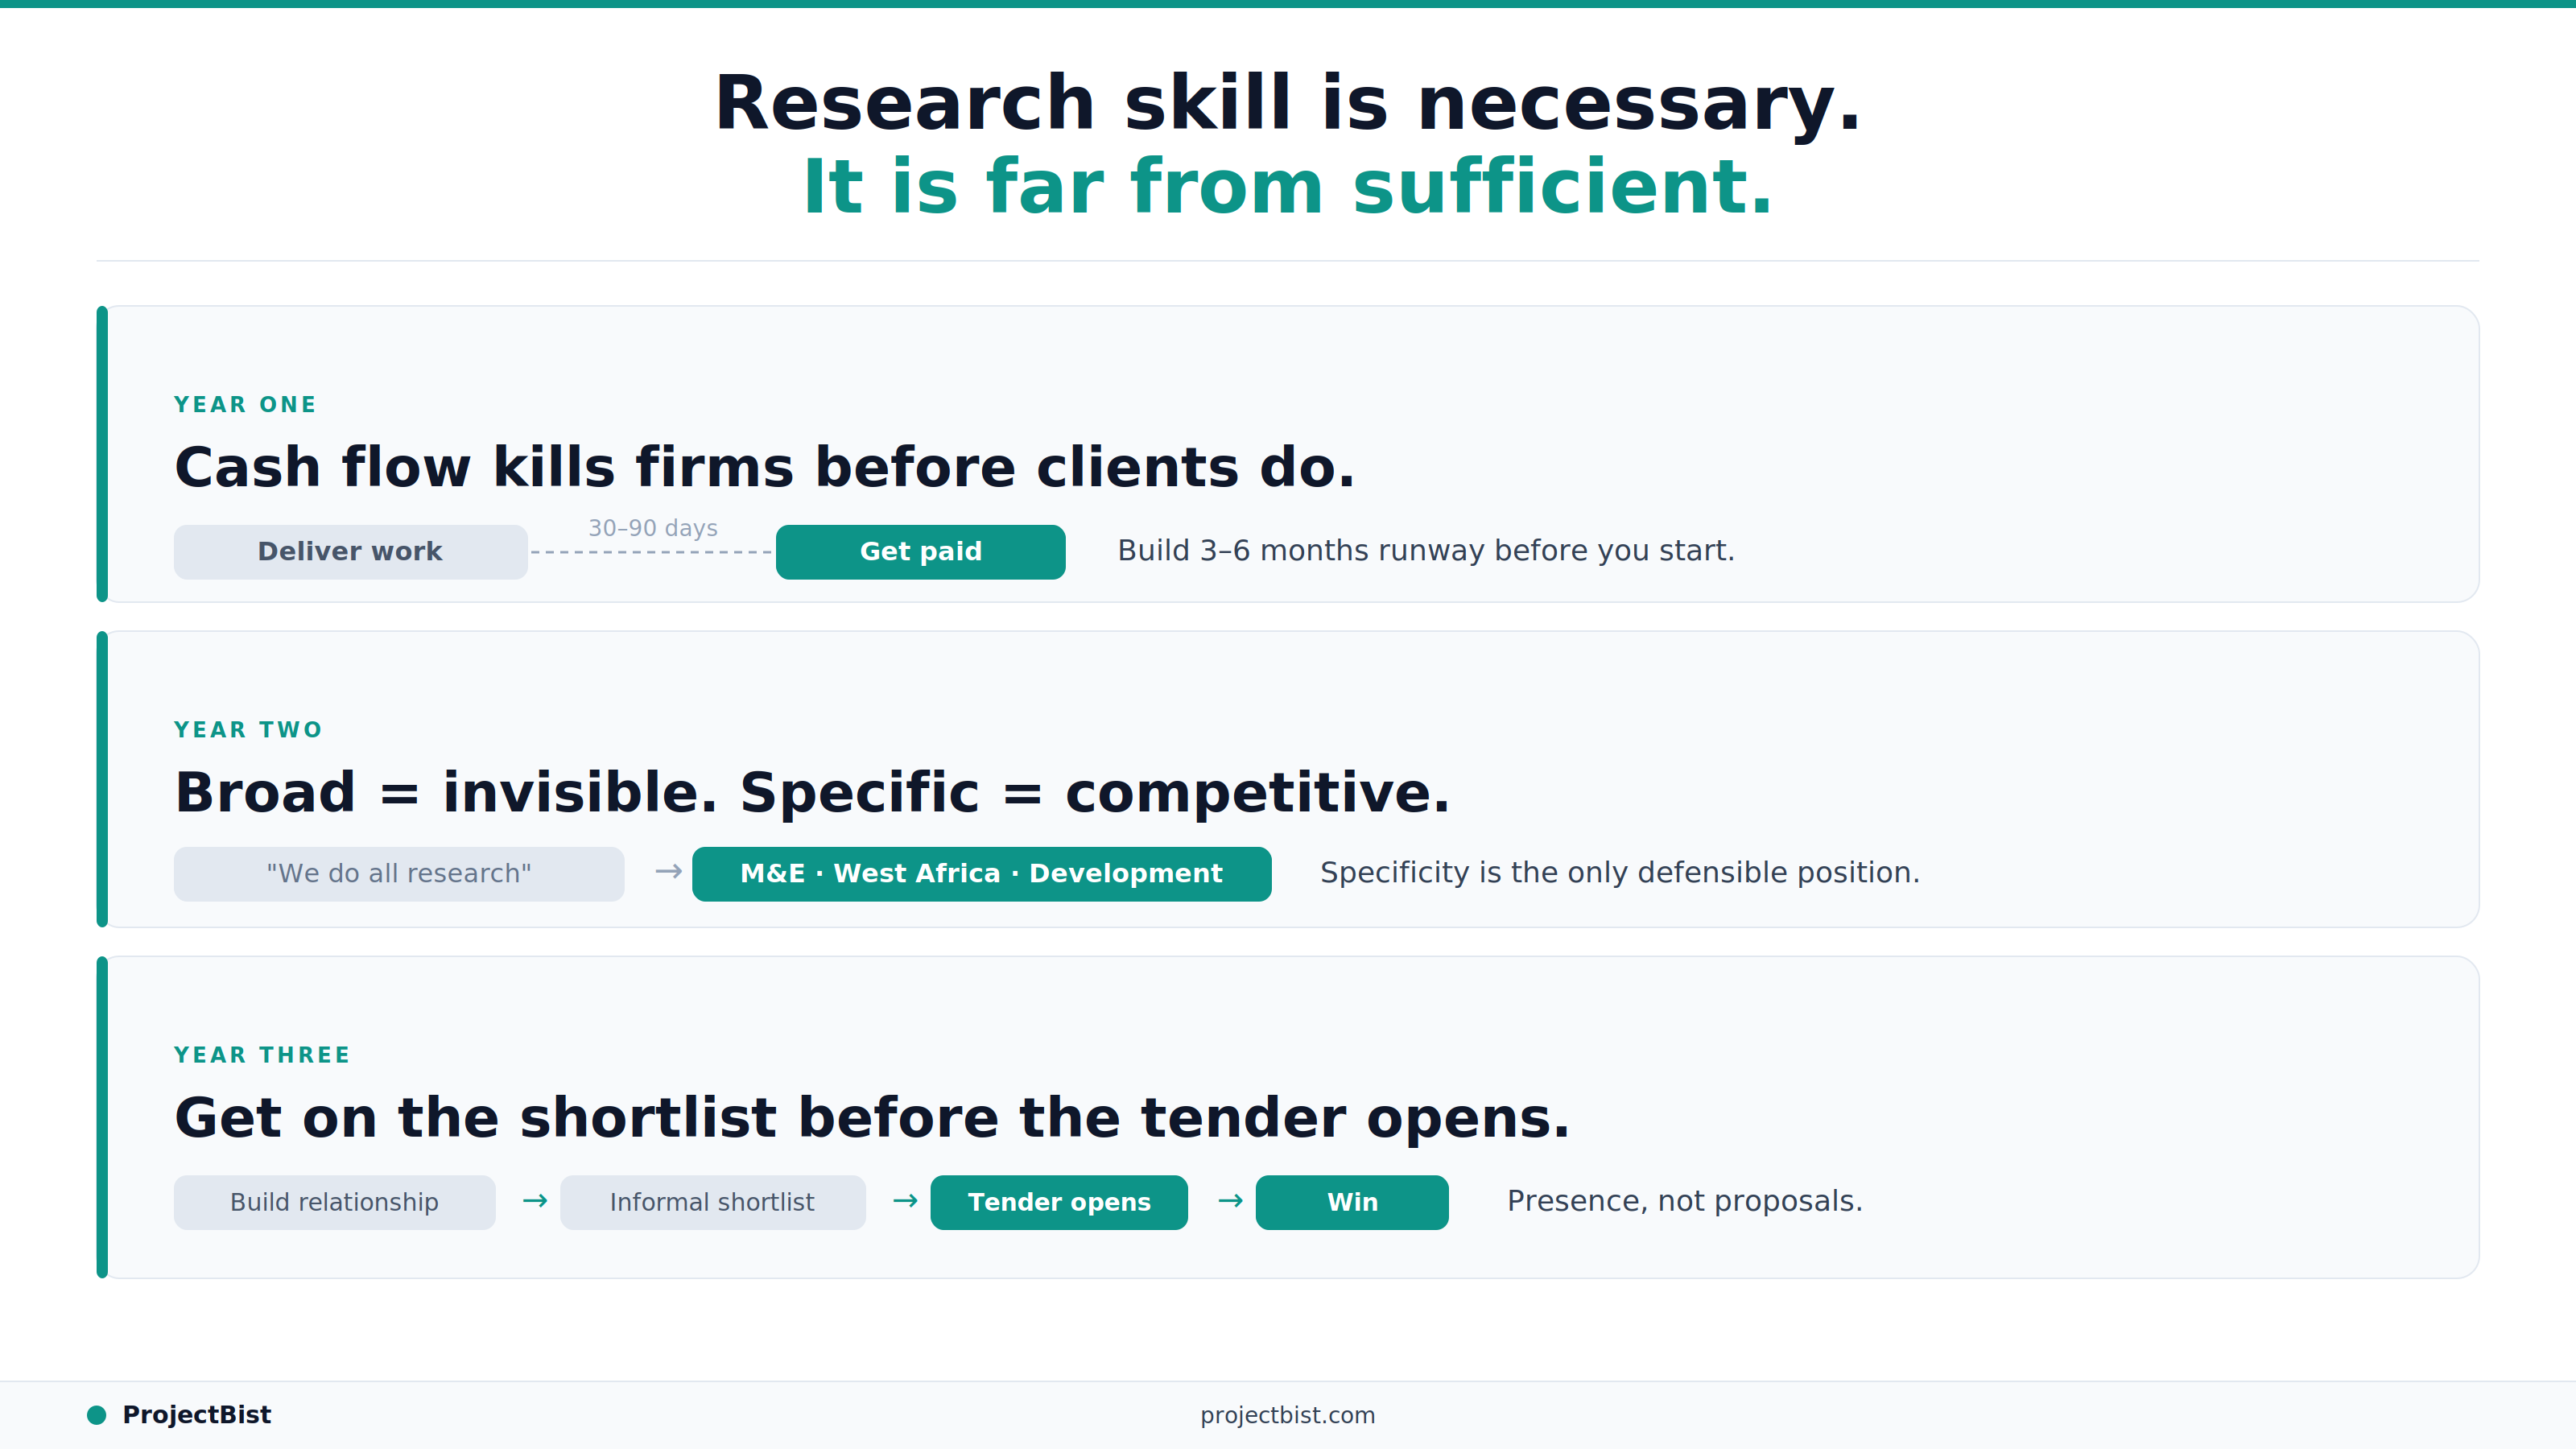
How to Build a Research Firm From Scratch: What the First Three Years Actually Require